TiDB TPC-H 50G Performance Test Report V2.1 Test purpose This test aims to compare the performances of TiDB 2.0 and TiDB 2.1 in the OLAP scenario.
Note
Different test environments might lead to different test results.
Test environment System information:
Machine IP Operation system Kernel version File system type 10.0.1.4 CentOS 7.5.1804 64bit 3.10.0-862.3.3.el7.x86_64 ext4 10.0.1.5 CentOS 7.5.1804 64bit 3.10.0-862.3.3.el7.x86_64 ext4 10.0.1.6 CentOS 7.5.1804 64bit 3.10.0-862.3.3.el7.x86_64 ext4 10.0.1.7 CentOS 7.5.1804 64bit 3.10.0-862.3.3.el7.x86_64 ext4 10.0.1.8 CentOS 7.5.1804 64bit 3.10.0-862.3.3.el7.x86_64 ext4 10.0.1.9 CentOS 7.5.1804 64bit 3.10.0-862.3.3.el7.x86_64 ext4
Hardware information:
Type 10.0.1.4 10.0.1.5, 10.0.1.6, 10.0.1.7, 10.0.1.8, 10.0.1.9 CPU 16 vCPUs, Intel(R) Xeon(R) CPU E5-2660 0 @ 2.20GHz 8 vCPUs, Intel(R) Xeon(R) CPU E5-2660 0 @ 2.20GHz Memory 110G 55G Disk 221G SSD 111G SSD Network card 10 Gigabit Ethernet, 10000Mb/s 10 Gigabit Ethernet, 10000Mb/s
TPC-H tidb-bench/tpch
Cluster topology Machine IP Deployment Instance 10.0.1.5 TiKV * 1 10.0.1.6 TiKV * 1 10.0.1.7 TiKV * 1 10.0.1.8 TiKV * 1 10.0.1.9 TiKV * 1 10.0.1.4 PD * 1 10.0.1.4 TiDB * 1
TiDB 2.0:
Component Version Commit Hash TiDB v2.0.7 29ec059cb3b7d14b6f52c2f219f94a89570162bc TiKV v2.0.7 d0b8cd7c7f62f06e7ef456837bd32a47da1ca4cd PD v2.0.5 b64716707b7279a4ae822be767085ff17b5f3fea
TiDB 2.1:
Component Version Commit Hash TiDB v2.1.0-rc.2 16864f95b47f859ed6104555ccff0387abdc2429 TiKV v2.1.0-rc.2 8458ce53ebbd434c48baac6373fe0f0a43a54005 PD v2.1.0-rc.2 55db505e8f35e8ab4e00efd202beb27a8ecc40fb
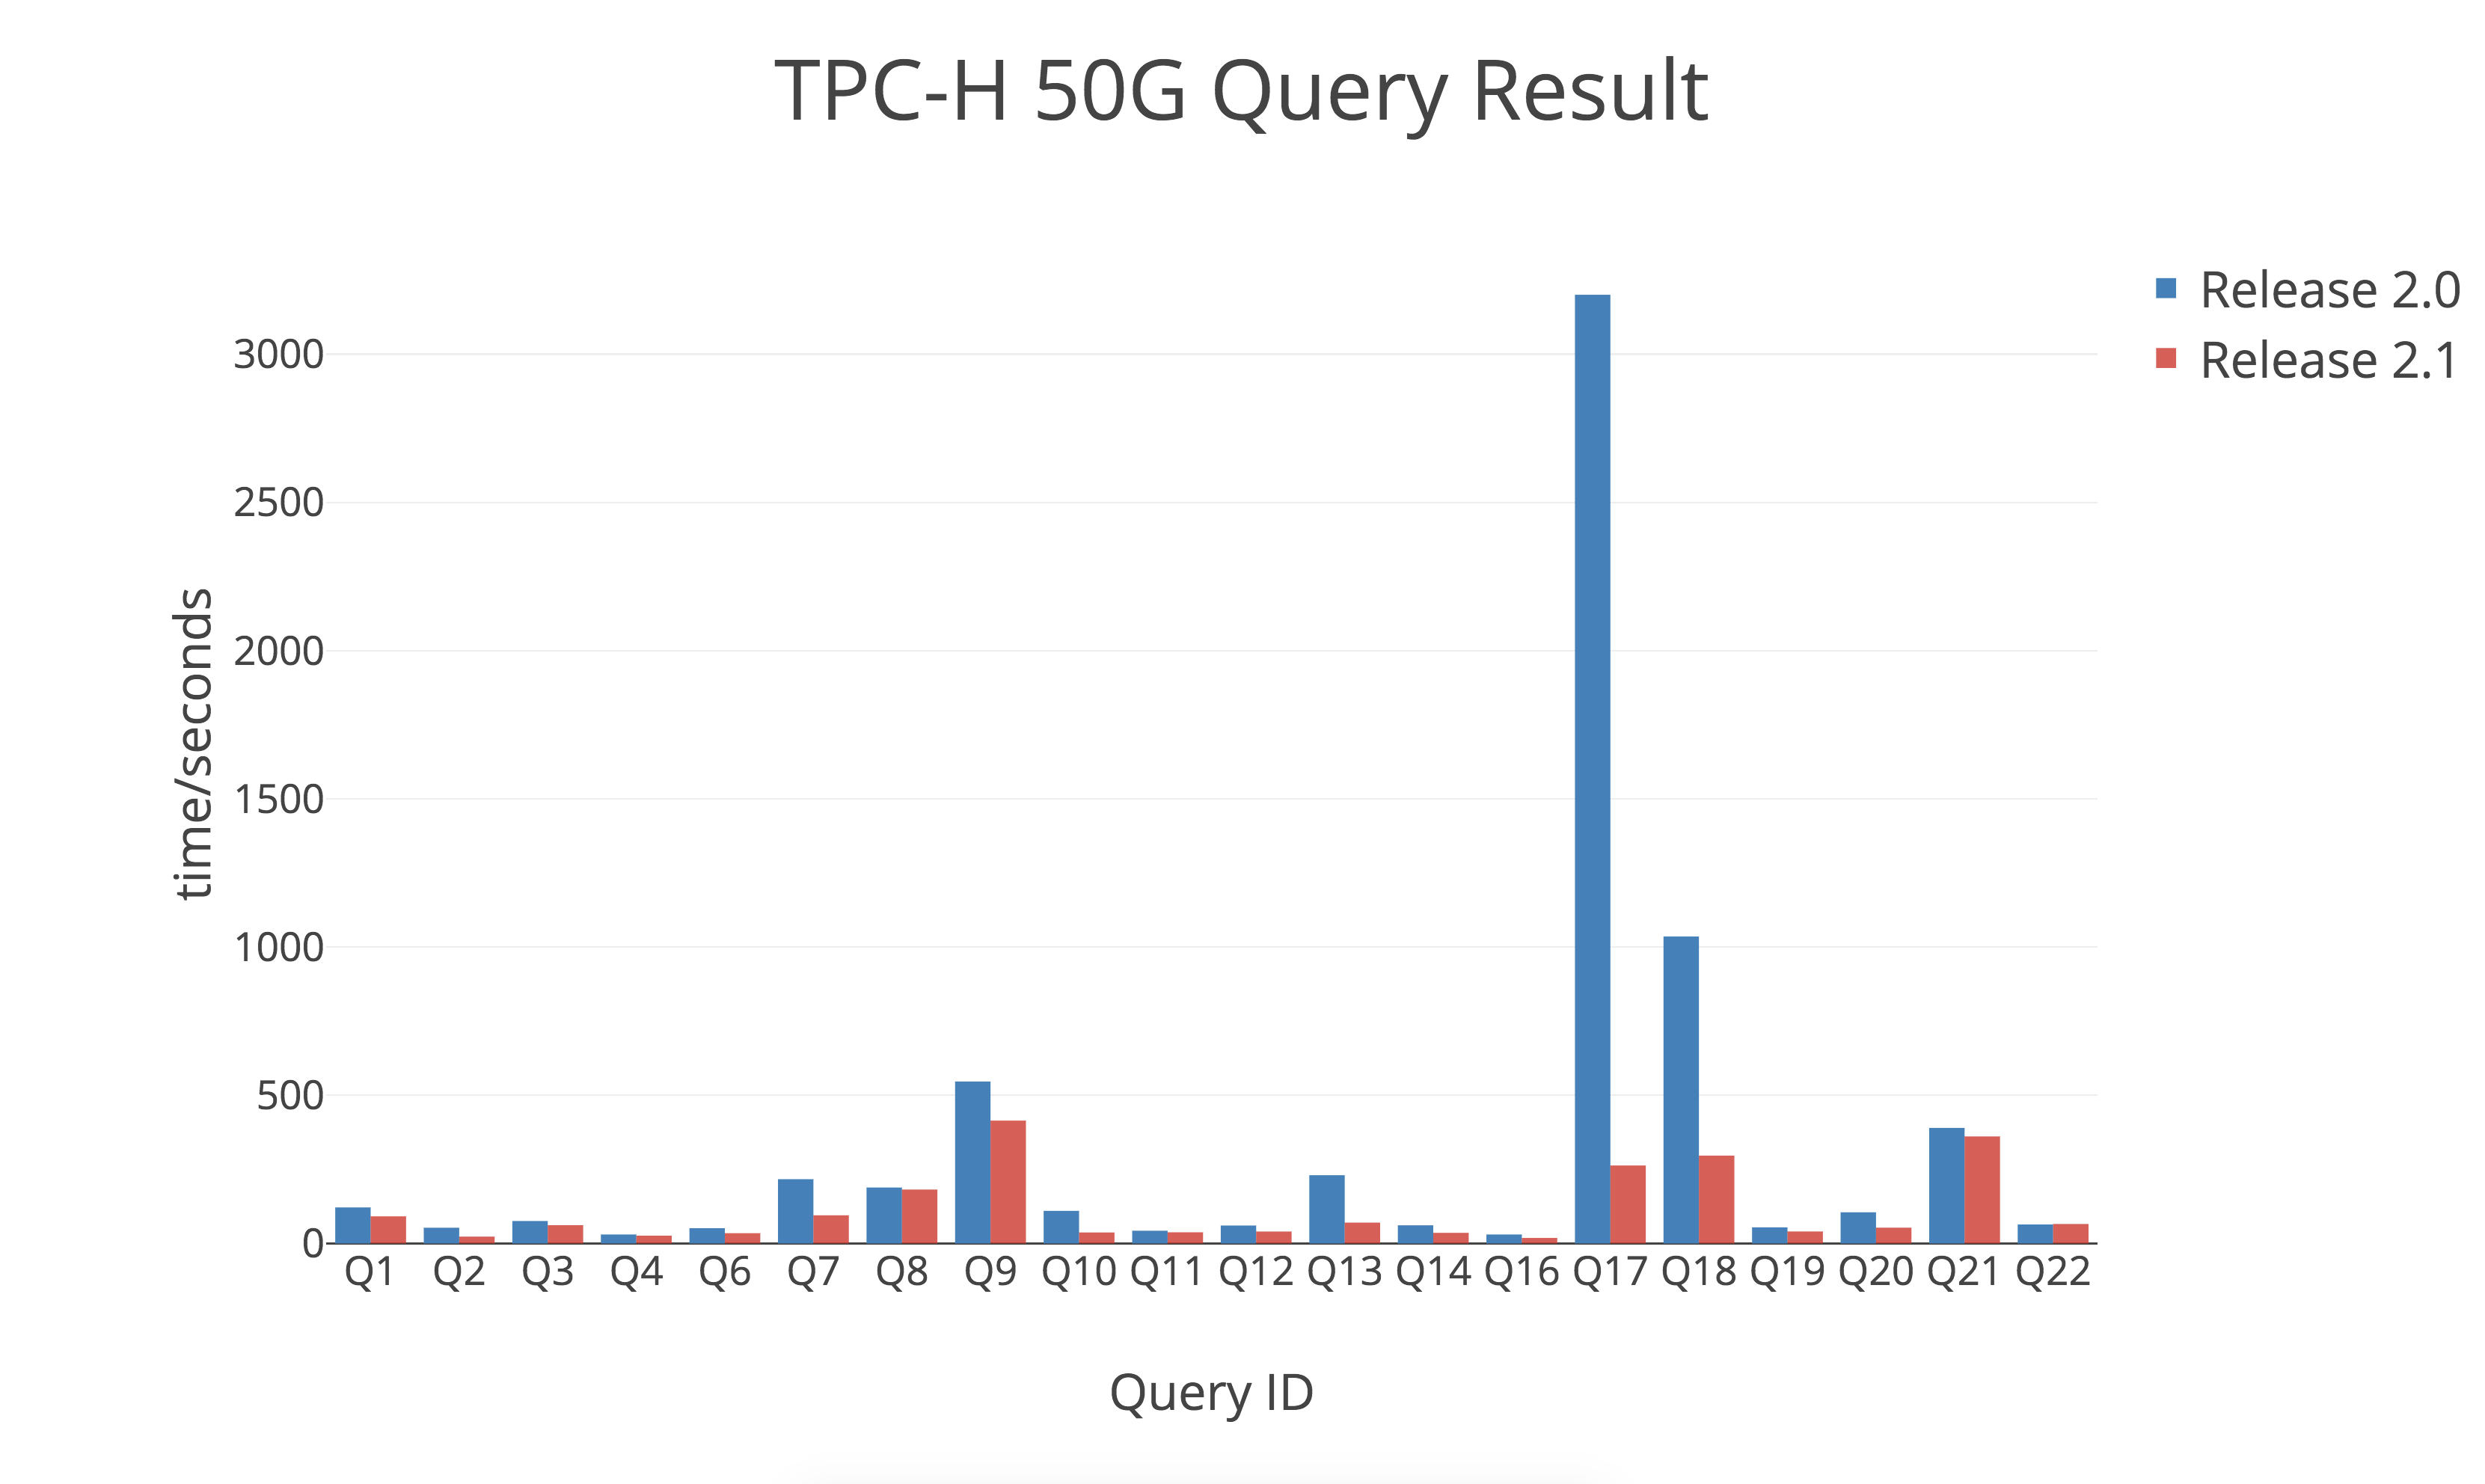
Test result Query ID TiDB 2.0 TiDB 2.1 1 121.550595999s 91.4755480289s 2 53.0638680458s 23.1186130047s 3 75.7236940861s 61.790802002s 4 30.2647120953s 26.3483440876s 6 51.4850790501s 34.6432199478s 7 216.787364006s 94.9856910706s 8 188.717588902s 181.852752209s 9 546.438174009s 414.462754965s 10 109.978317022s 37.0369961262s 11 42.9398438931s 37.6951580048s 12 60.455039978s 40.2236878872s 13 230.278712988s 70.2887151241s 14 61.2673521042s 35.8372960091s 16 30.2539310455s 18.5897550583s 17 3200.70173788s 263.095014811s 18 1035.59847498s 296.360667944s 19 54.3732938766s 40.4523630142s 20 105.094577074s 53.2429068089s 21 389.883709908s 361.034544945s 22 64.0494630337s 65.7153418064s
It should be noted that:
In the diagram above, the red bars represent the query results of Release 2.1 and the blue bars represent the query results of Release 2.0. The y-axis represents the processing time of queries in seconds, the shorter the faster. The result of Query 15 is not displayed because VIEW is currently not supported in either TiDB 2.1 or 2.0. The result of Query 5 is not displayed because no result is returned during a long period of time caused by the Join Order issue.