Overview Page
This page shows the overview of the entire TiDB cluster, including the following information:
- Queries per second (QPS) of the entire cluster.
- The query latency of the entire cluster.
- The SQL statements that have accumulated the longest execution time over the recent period.
- The slow queries whose execution time over the recent period exceeds the threshold.
- The node count and status of each instance.
- Monitor and alert messages.
Access the page
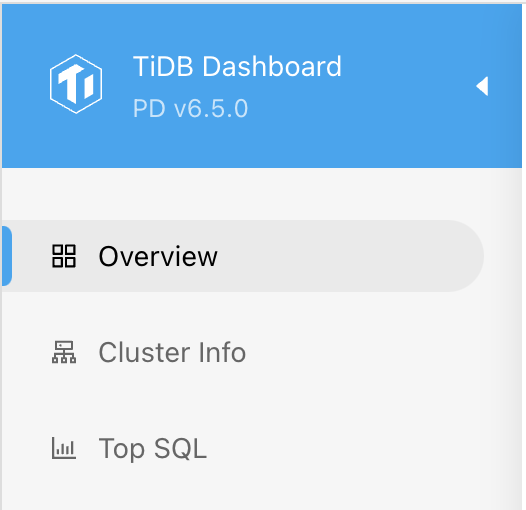
After logging in to TiDB Dashboard, the overview page is entered by default, or you can click Overview in the left navigation menu to enter this page:
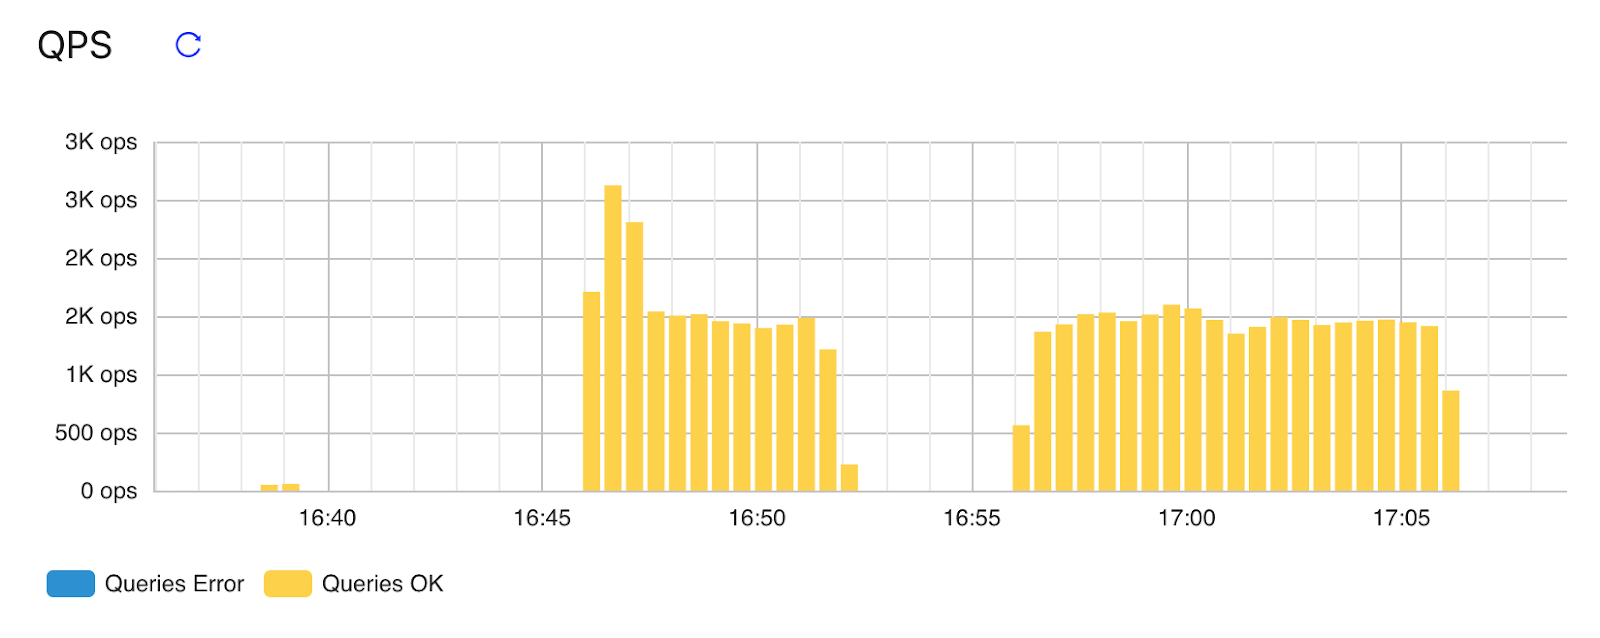
QPS
This area shows the number of successful and failed queries per second for the entire cluster over the recent hour:
Latency
This area shows the latency of 99.9%, 99%, and 90% of queries in the entire cluster over the recent one hour:

Top SQL statements
This area shows the ten types of SQL statements that have accumulated the longest execution time in the entire cluster over the recent period. SQL statements with different query parameters but of the same structure are classified into the same SQL type and displayed in the same row:
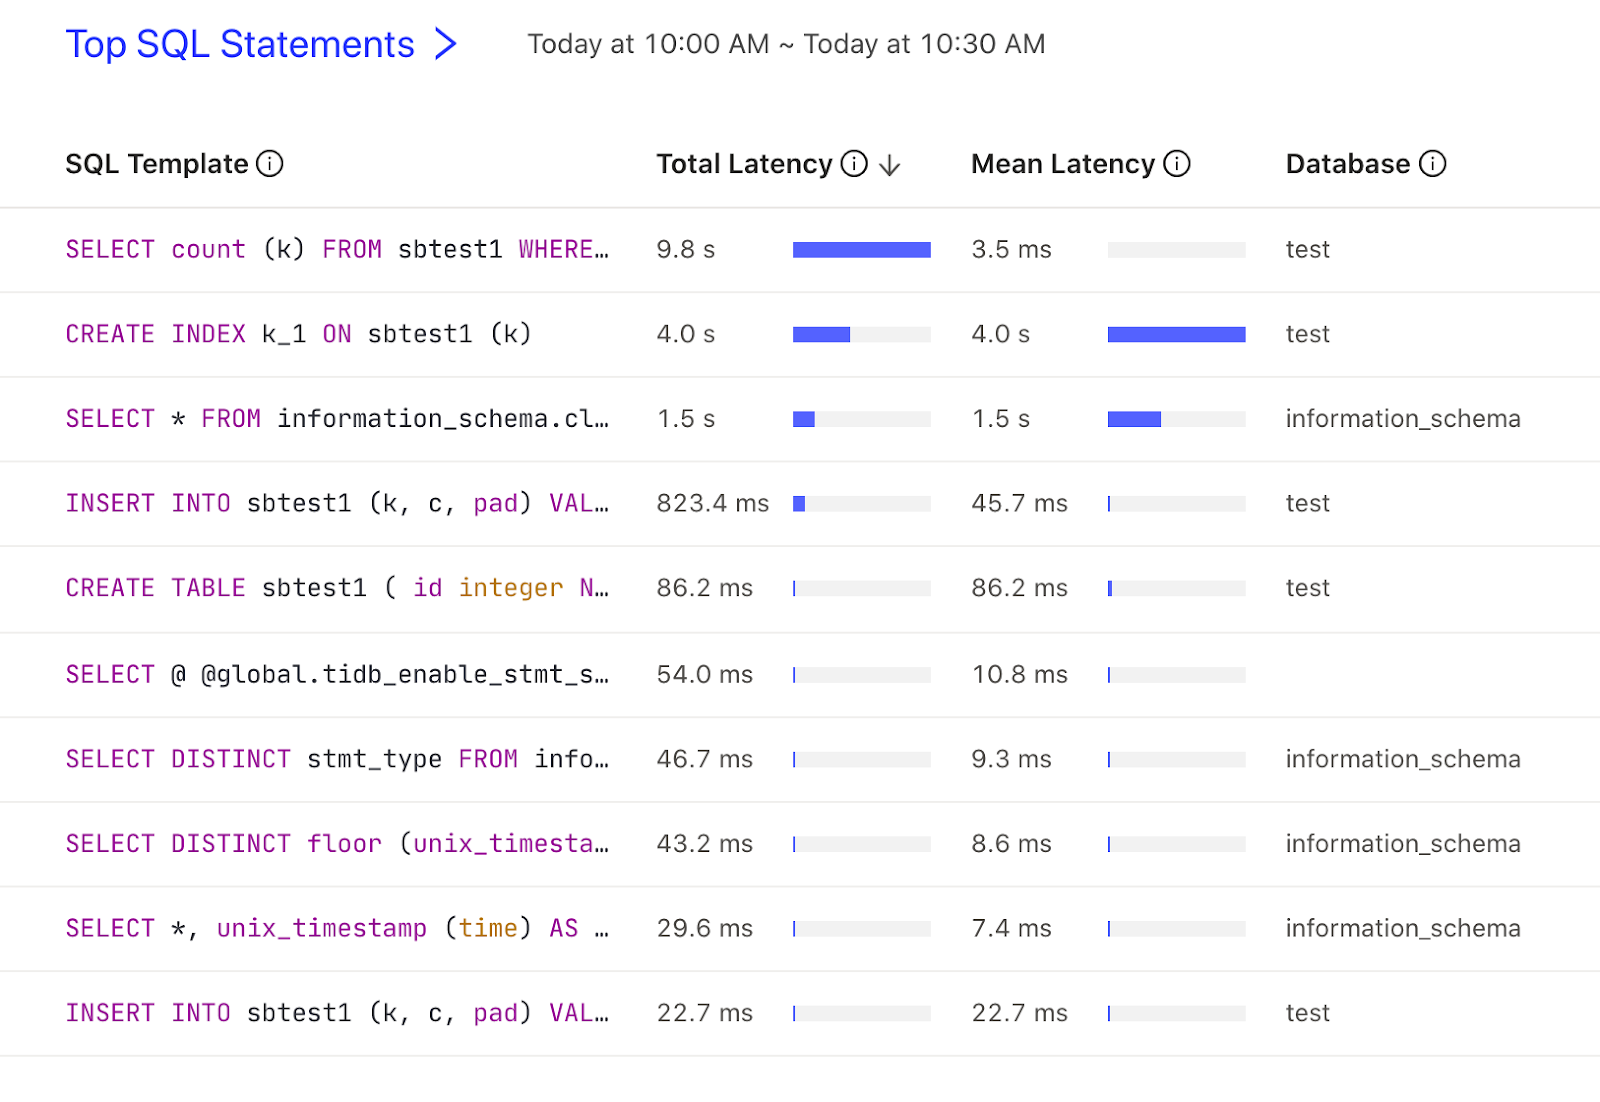
The information shown in this area is consistent with the more detailed SQL Statements Page. You can click the Top SQL Statements heading to view the complete list. For details of the columns in this table, see SQL Statements Page.
Recent slow queries
By default, this area shows the latest 10 slow queries in the entire cluster over the recent 30 minutes:
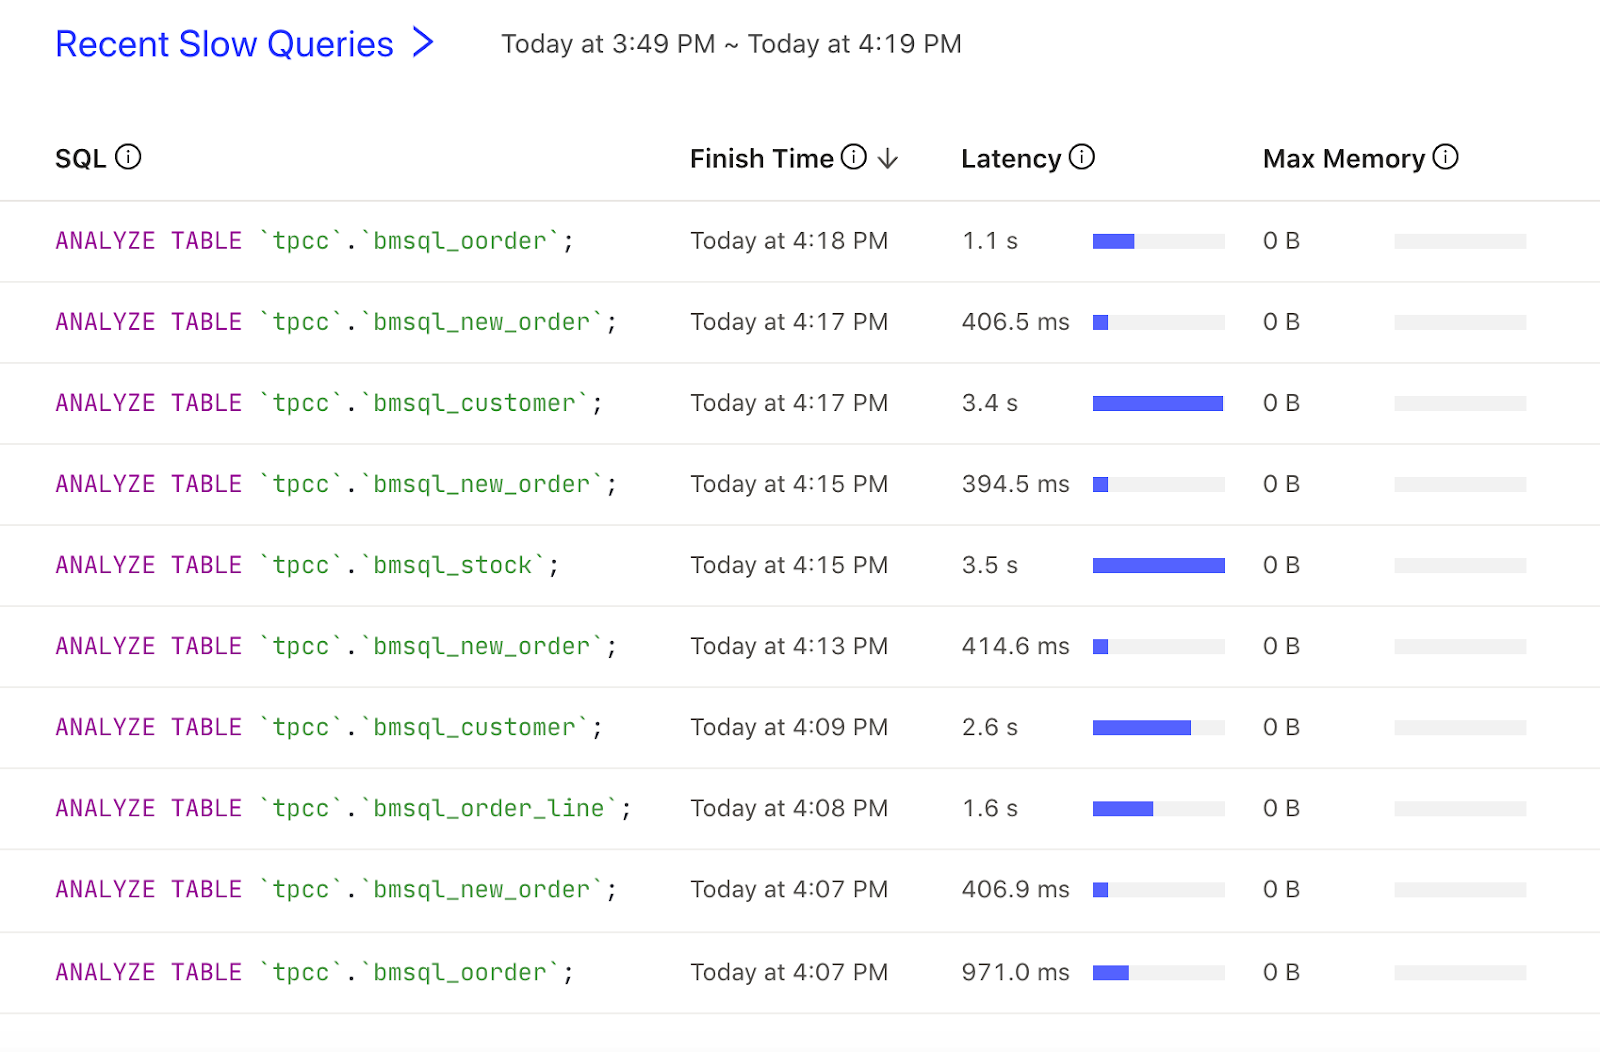
By default, the SQL query that is executed longer than 300 milliseconds is counted as a slow query and displayed on the table. You can change this threshold by modifying the tidb_slow_log_threshold variable or the instance.tidb_slow_log_threshold TiDB parameter.
The content displayed in this area is consistent with the more detailed Slow Queries Page. You can click the Recent Slow Queries title to view the complete list. For details of the columns in this table, see this Slow Queries Page.
Instances
This area summarizes the total number of instances and abnormal instances of TiDB, TiKV, PD, and TiFlash in the entire cluster:
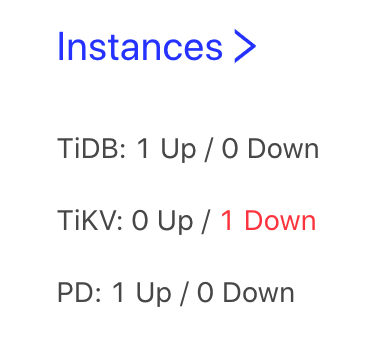
The statuses in the preceding image are described as follows:
- Up: The instance is running properly (including the offline storage instance).
- Down: The instance is running abnormally, such as network disconnection and process crash.
Click the Instance title to enter the Cluster Info Page that shows the detailed running status of each instance.
Monitor and alert
This area provides links for you to view detailed monitor and alert:
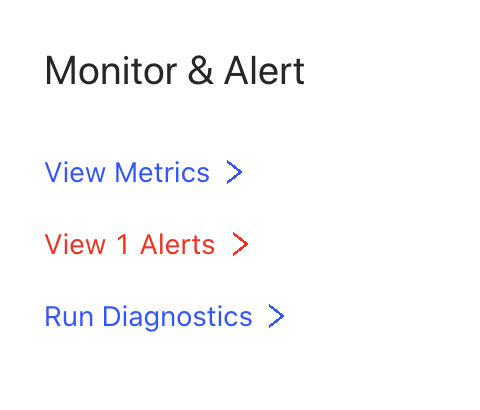
- View Metrics: Click this link to jump to the Grafana dashboard where you can view detailed monitoring information of the cluster. For details of each monitoring metric in the Grafana dashboard, see monitoring metrics.
- View Alerts: Click this link to jump to the AlertManager page where you can view detailed alert information of the cluster. If alerts exist in the cluster, the number of alerts is directly shown in the link text.
- Run Diagnostics: Click this link to jump to the more detailed cluster diagnostics page.