Check Cluster Status
This document describes how to check the cluster status via TiDB Dashboard and Grafana, and how to log in to the TiDB database to perform simple DML and DDL operations and SQL queries.
Check the TiDB cluster status
This section describes how to check the TiDB cluster status using TiDB Dashboard and Grafana.
Use TiDB Dashboard
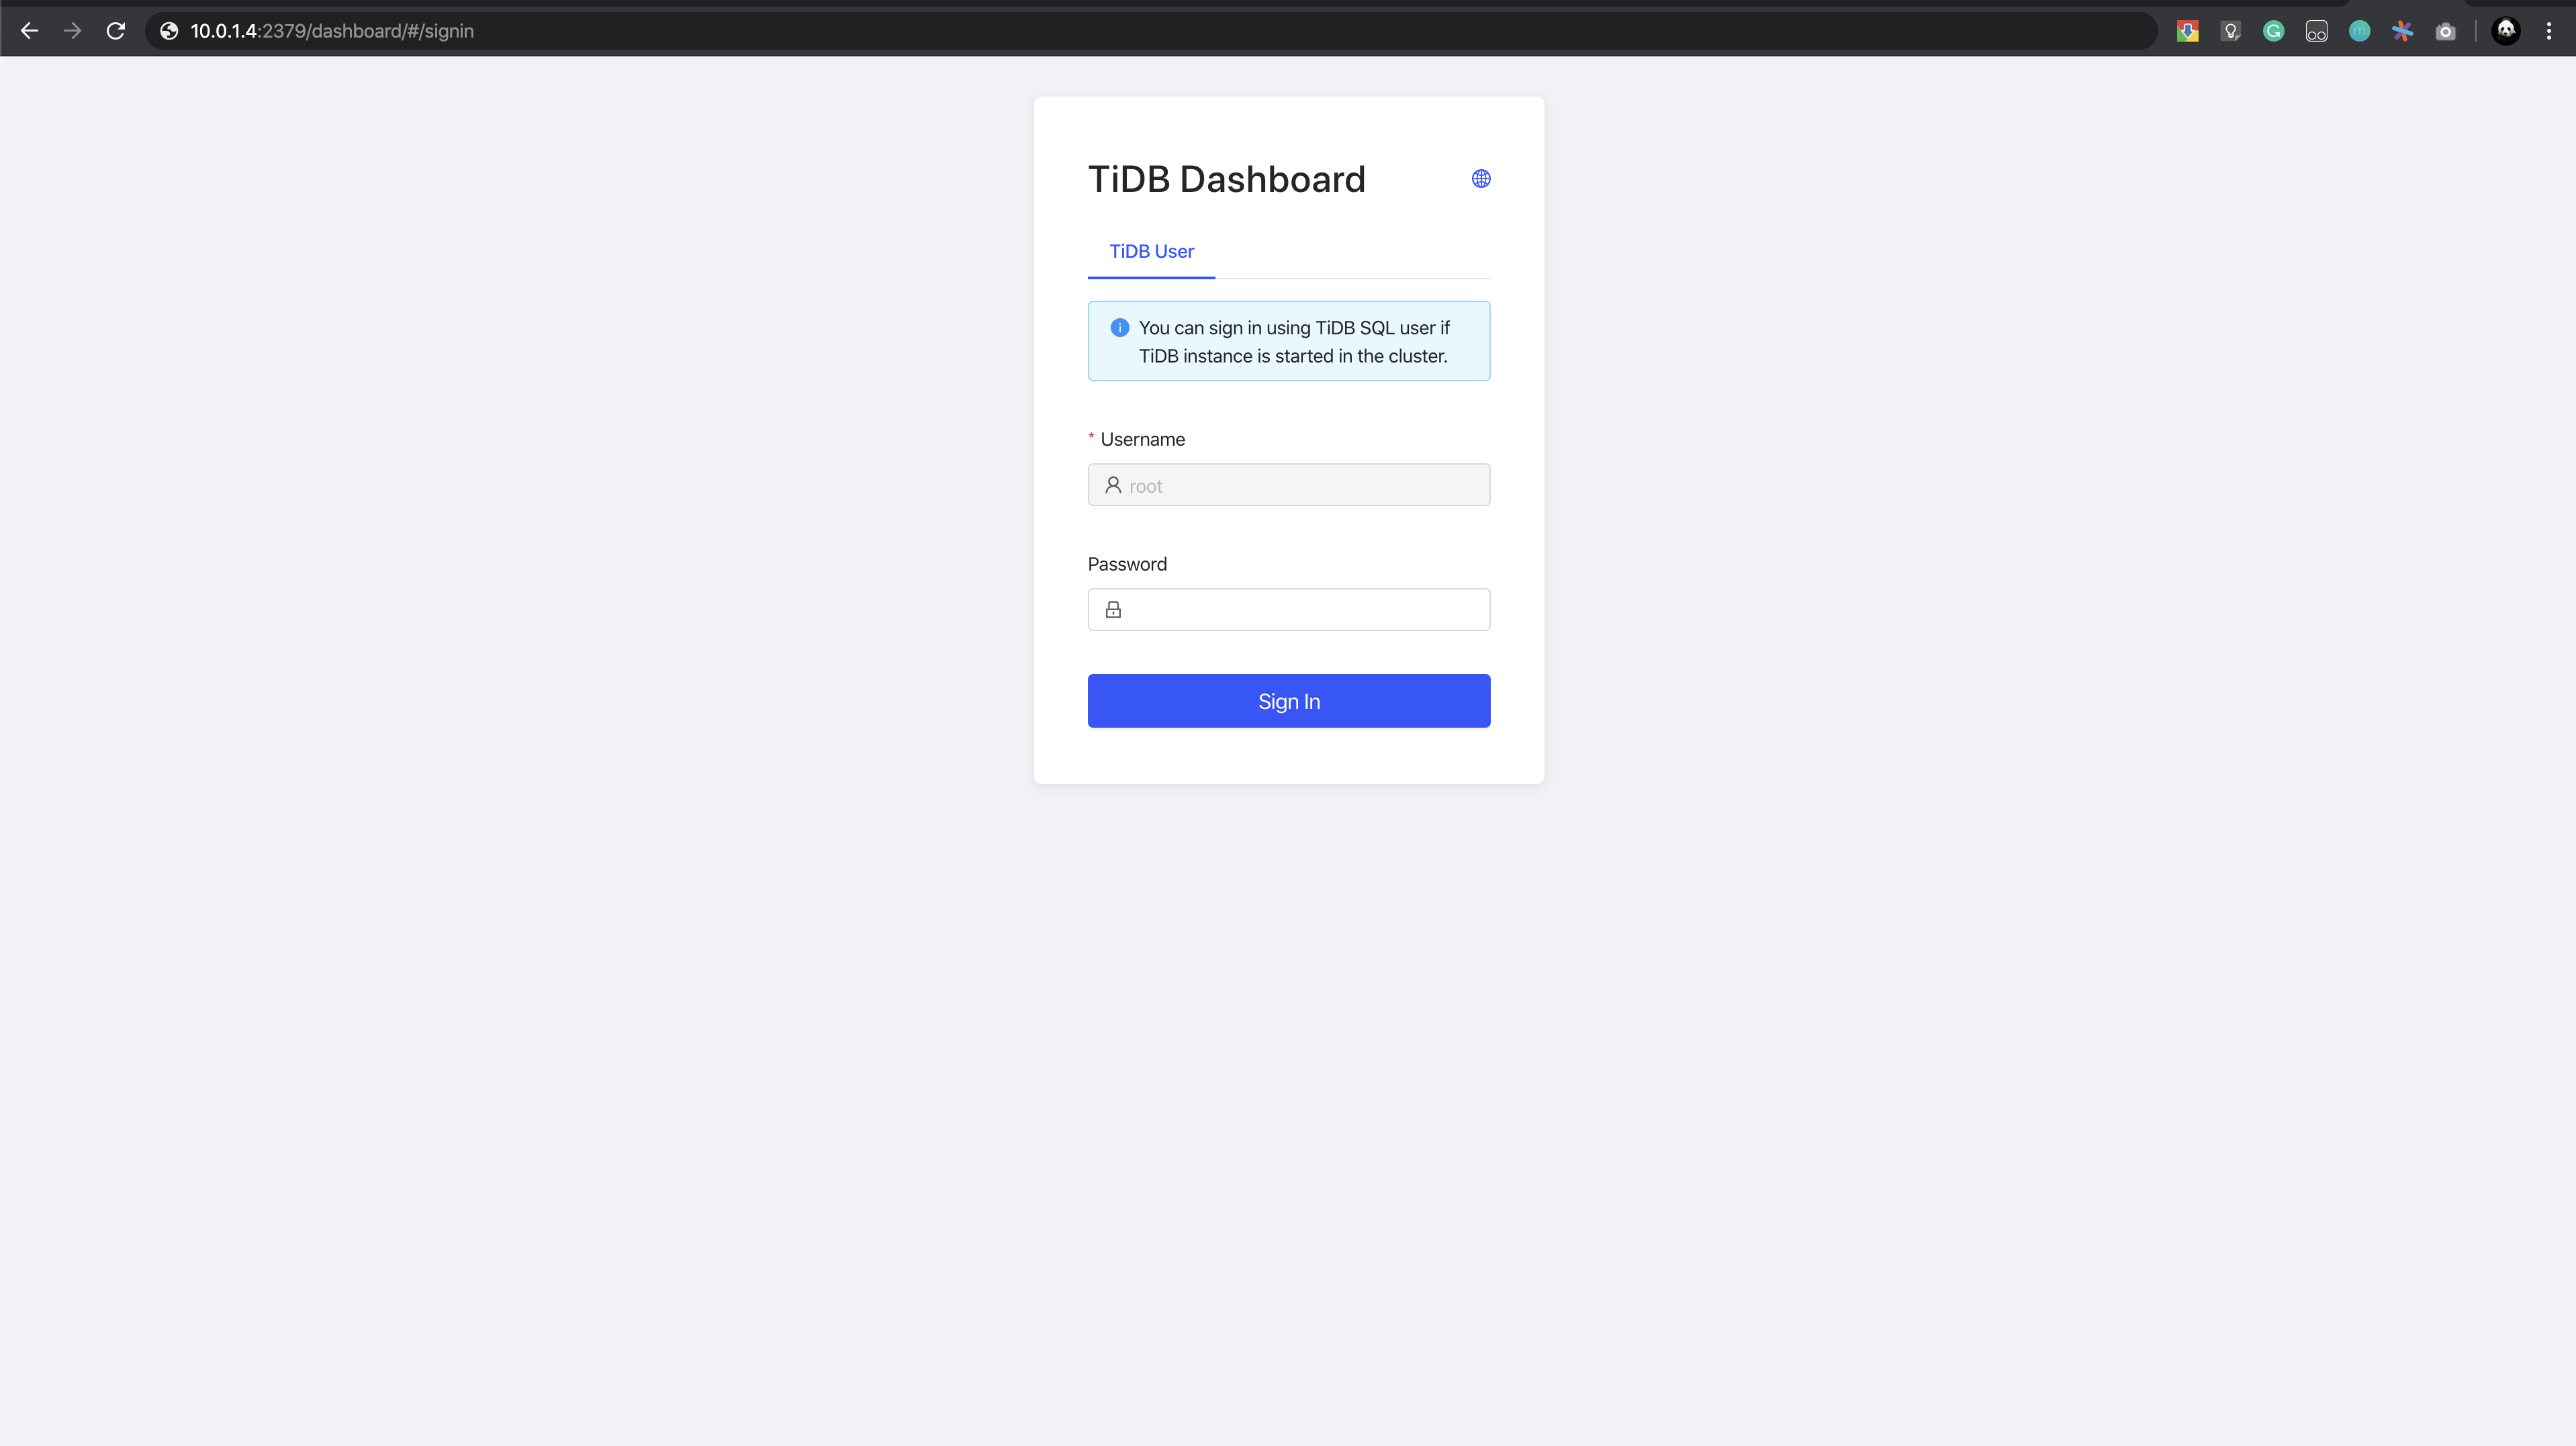
Log in to TiDB Dashboard at
${pd-ip}:${pd-port}/dashboard. The username and password is the same as that of the TiDBrootuser. If you have modified therootpassword, enter the modified password. The password is empty by default.
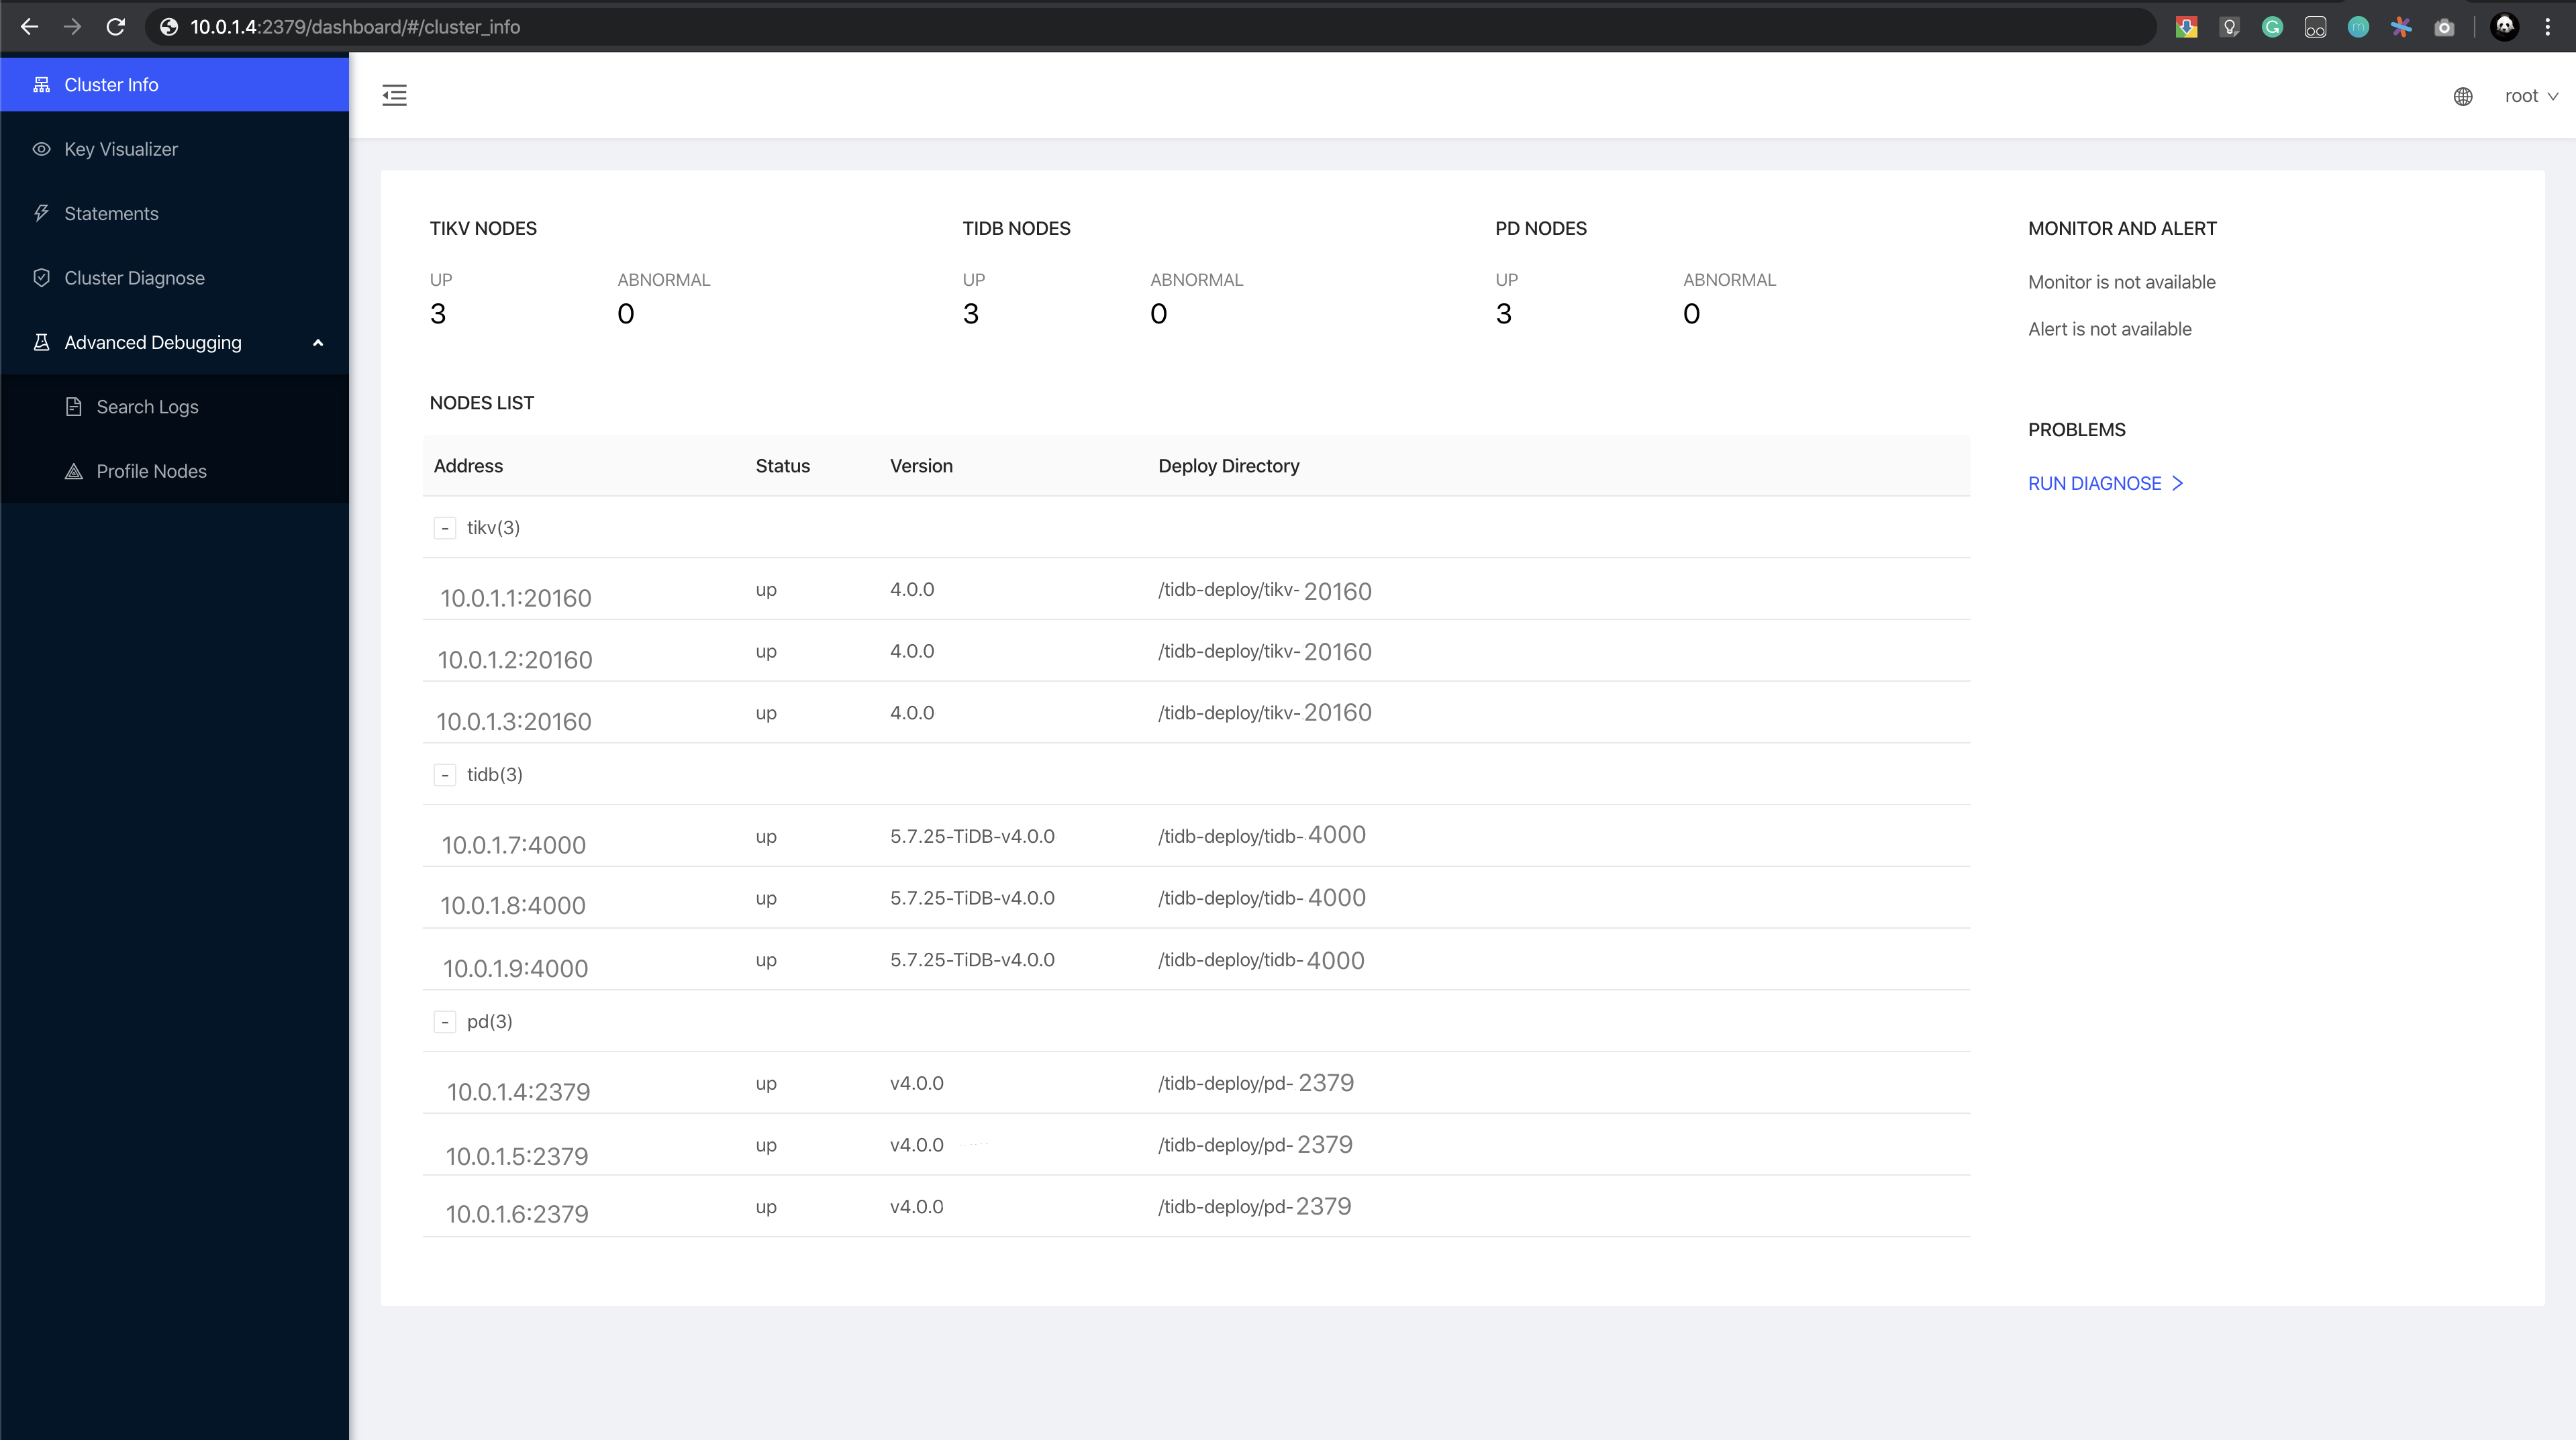
The home page displays the node information in the TiDB cluster.

Use Grafana
Log in to the Grafana monitoring at
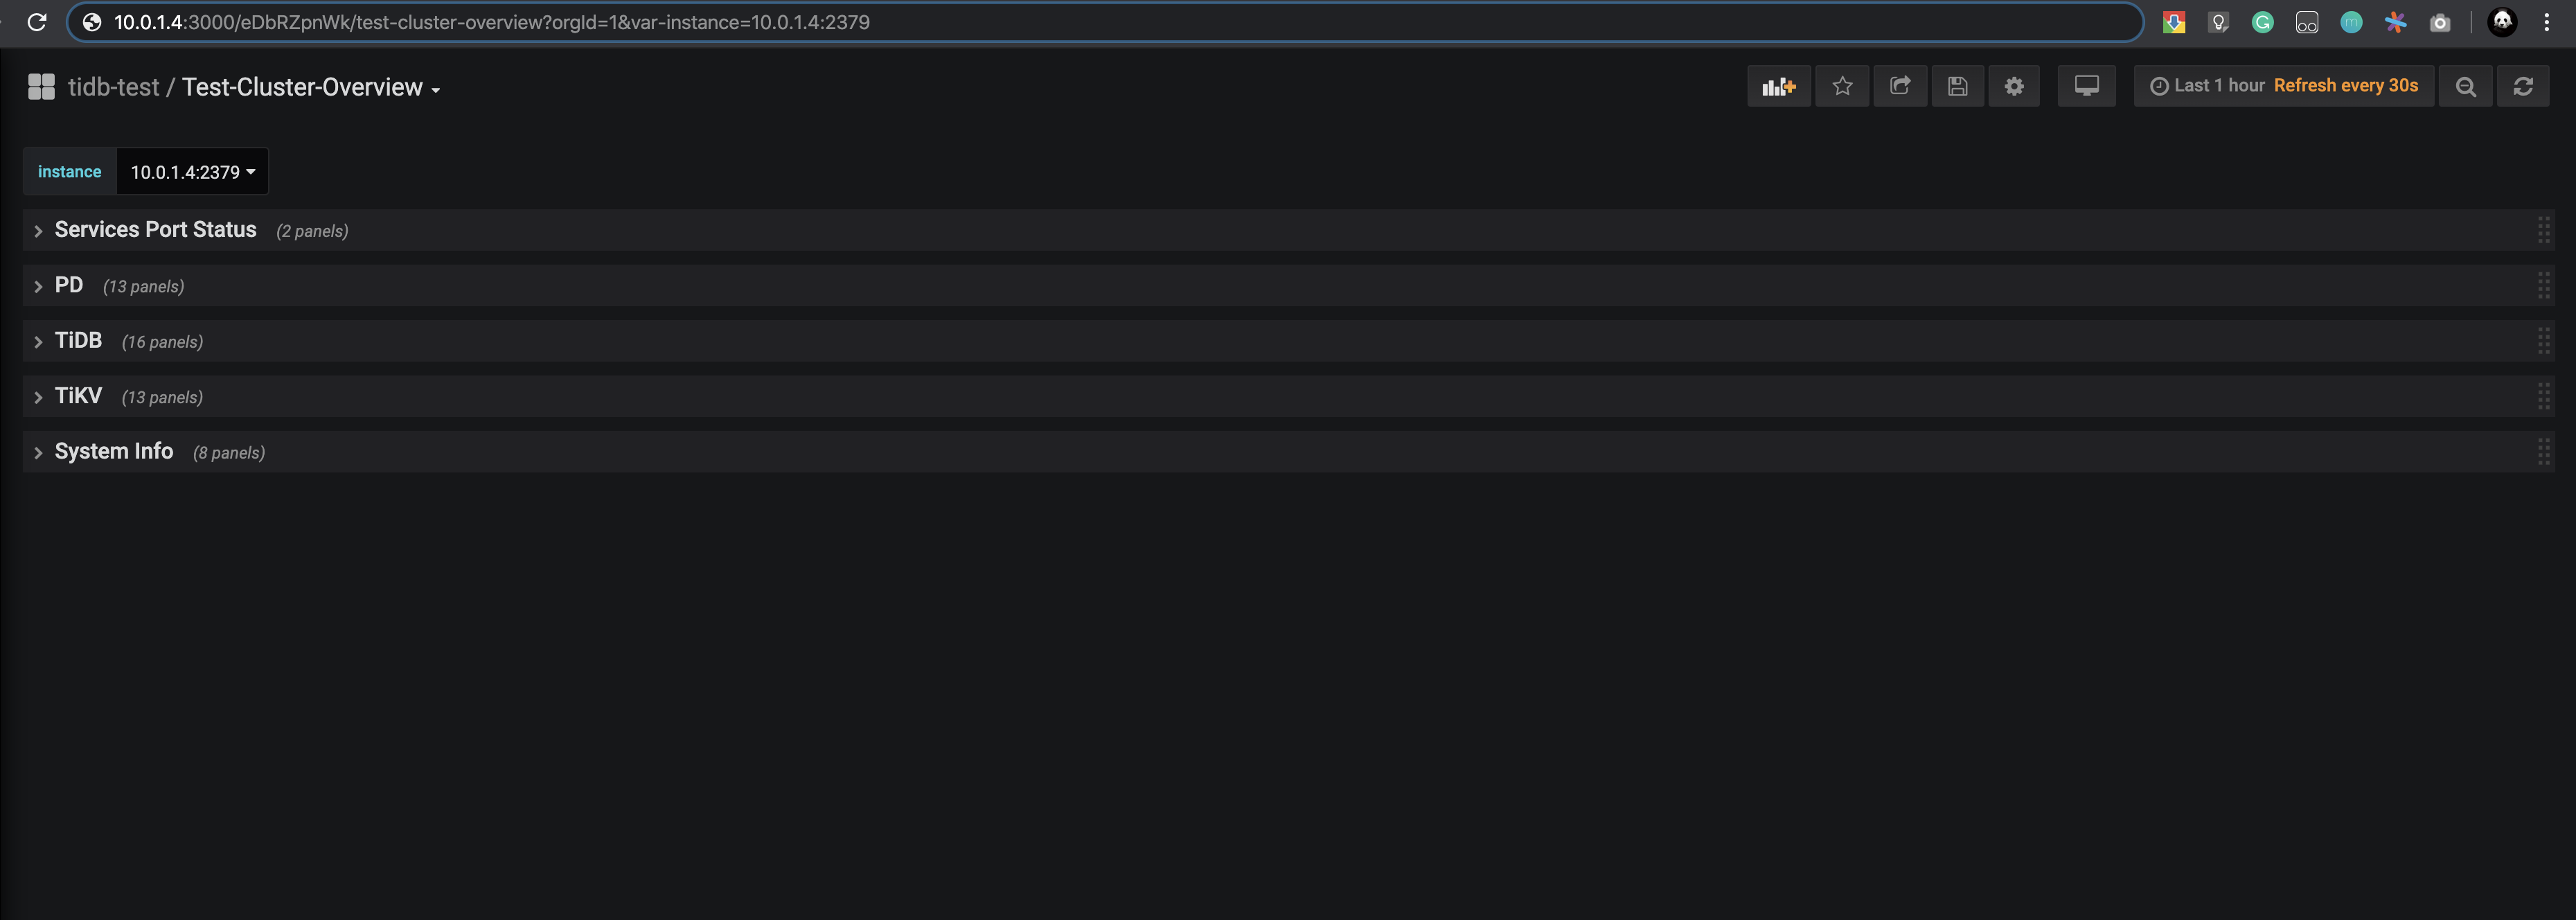
${Grafana-ip}:3000. The default username and password are bothadmin.To check the TiDB port status and load monitoring information, click Overview.

Log in to the database and perform simple operations
Log in to the database by running the following command:
mysql -u root -h 10.0.1.4 -P 4000
The following information indicates successful login:
Welcome to the MySQL monitor.  Commands end with ; or \g.
Your MySQL connection id is 3
Server version: 5.7.25-TiDB-v4.0.0 TiDB Server (Apache License 2.0) Community Edition, MySQL 5.7 compatible
Copyright (c) 2000, 2015, Oracle and/or its affiliates. All rights reserved.
Oracle is a registered trademark of Oracle Corporation and/or its
affiliates. Other names may be trademarks of their respective
owners.

Type 'help;' or '\h' for help. Type '\c' to clear the current input statement.
Database operations
- Check the version of TiDB:
```sql
select tidb_version()\G
```

Expected output:

```sql
*************************** 1. row ***************************
tidb_version(): Release Version: v4.0.0
Edition: Community
Git Commit Hash: 689a6b6439ae7835947fcaccf329a3fc303986cb
Git Branch: HEAD
UTC Build Time: 2020-05-28 11:09:45
GoVersion: go1.13.4
Race Enabled: false
TiKV Min Version: v3.0.0-60965b006877ca7234adaced7890d7b029ed1306
Check Table Before Drop: false
1 row in set (0.00 sec)
```
- Create a database named
pingcap:
```sql
create database pingcap;
```

Expected output:

```sql
Query OK, 0 rows affected (0.10 sec)
```

Switch to the `pingcap` database:


```sql
use pingcap;
```

Expected output:

```sql
Database changed
```
- Create a table named
tab_tidb:
```sql
CREATE TABLE `tab_tidb` (
`id` int(11) NOT NULL AUTO_INCREMENT,
`name` varchar(20) NOT NULL DEFAULT '',
`age` int(11) NOT NULL DEFAULT 0,
`version` varchar(20) NOT NULL DEFAULT '',
PRIMARY KEY (`id`),
KEY `idx_age` (`age`));
```

Expected output:

```sql
Query OK, 0 rows affected (0.11 sec)
```
- Insert data:
```sql
insert into `tab_tidb` values (1,'TiDB',5,'TiDB-v4.0.0');
```

Expected output:

```sql
Query OK, 1 row affected (0.03 sec)
```
- View the entries in
tab_tidb:
```sql
select * from tab_tidb;
```

Expected output:

```sql
+----+------+-----+-------------+
| id | name | age | version     |
+----+------+-----+-------------+
|  1 | TiDB |   5 | TiDB-v4.0.0 |
+----+------+-----+-------------+
1 row in set (0.00 sec)
```
- View the store state,
store_id, capacity, and uptime of TiKV:
```sql
select STORE_ID,ADDRESS,STORE_STATE,STORE_STATE_NAME,CAPACITY,AVAILABLE,UPTIME from INFORMATION_SCHEMA.TIKV_STORE_STATUS;
```

Expected output:

```sql
+----------+--------------------+-------------+------------------+----------+-----------+--------------------+
| STORE_ID | ADDRESS            | STORE_STATE | STORE_STATE_NAME | CAPACITY | AVAILABLE | UPTIME             |
+----------+--------------------+-------------+------------------+----------+-----------+--------------------+
|        1 | 10.0.1.1:20160 |           0 | Up               | 49.98GiB | 46.3GiB   | 5h21m52.474864026s |
|        4 | 10.0.1.2:20160 |           0 | Up               | 49.98GiB | 46.32GiB  | 5h21m52.522669177s |
|        5 | 10.0.1.3:20160 |           0 | Up               | 49.98GiB | 45.44GiB  | 5h21m52.713660541s |
+----------+--------------------+-------------+------------------+----------+-----------+--------------------+
3 rows in set (0.00 sec)
```
- Exit TiDB:
```sql
exit
```

Expected output:

```sql
Bye
```