Monitor a TiDB Cluster across Multiple Kubernetes Clusters
You can monitor a TiDB cluster that is deployed across multiple Kubernetes clusters and access the monitoring data from a global view. This document describes how to integrate with several popular multi-cluster monitoring solutions based on Prometheus, and how to use Grafana to visualize the data across multiple Kubernetes clusters:
- Push data from Prometheus
- The pull method - Using Thanos Query
- The pull method - Using Prometheus Federation
- Visualize monitoring data using Grafana
Push data from Prometheus
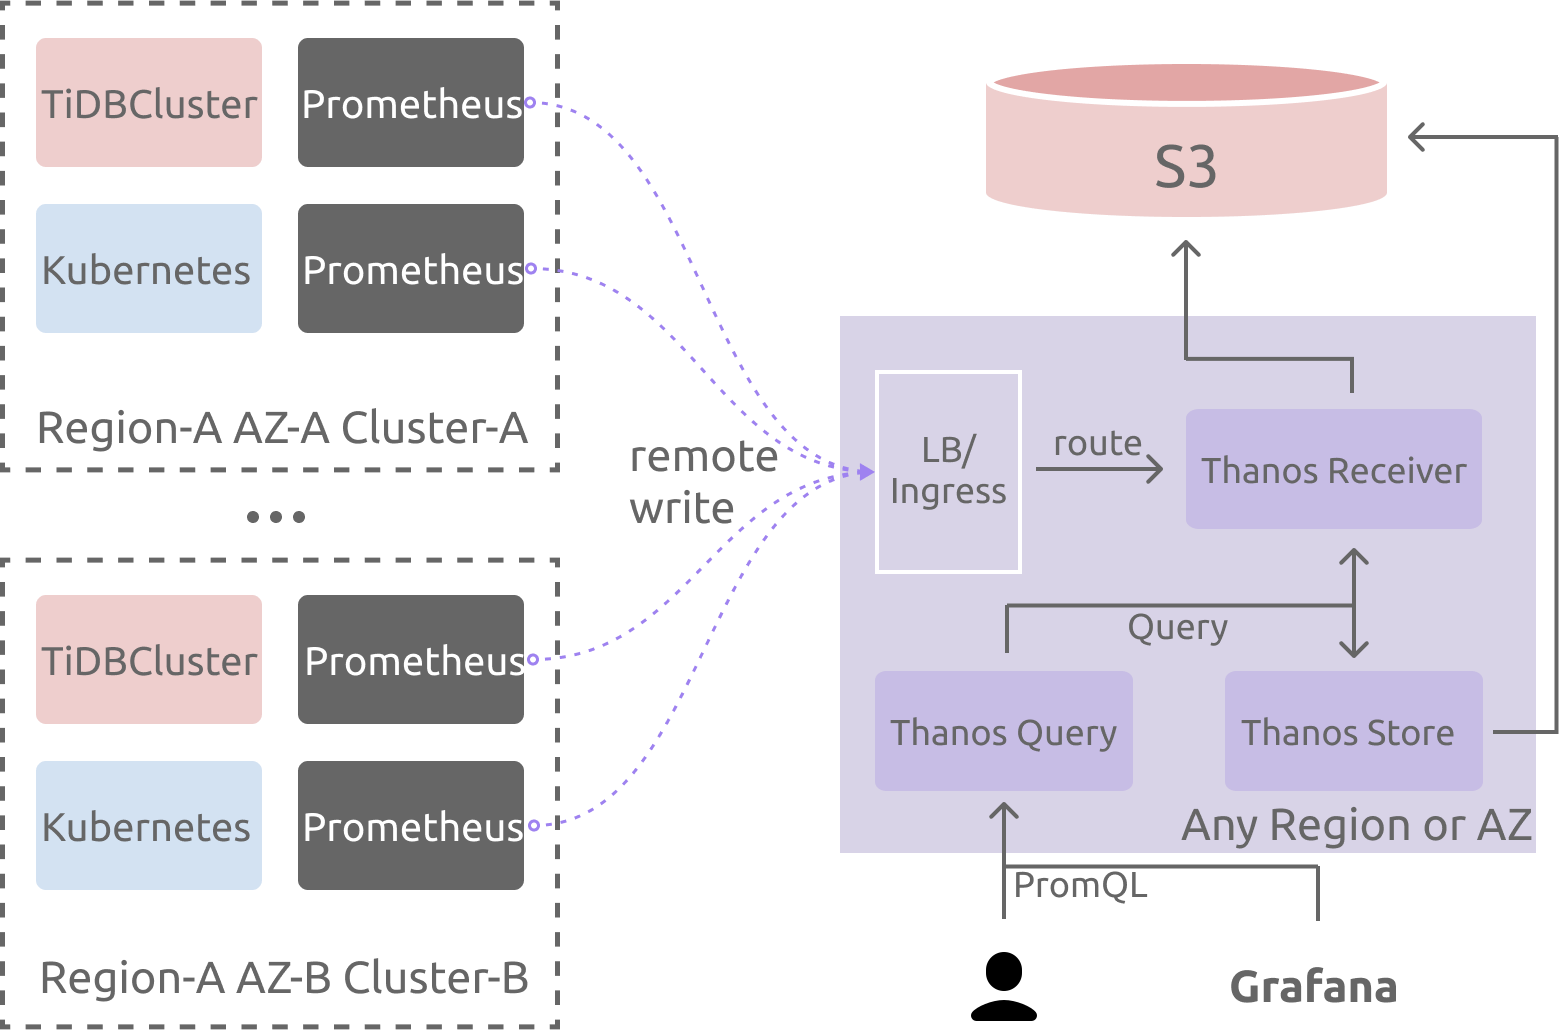
The push method uses the remote write feature of Prometheus, which requests the Prometheus instances in different Kubernetes clusters to push monitoring data to a centralized storage.
The push method described in this section is based on Thanos. If you use other centralized storage solutions compatible with the Prometheus remote API, you only need to replace the related Thanos components.
Prerequisites
The multiple Kubernetes clusters must meet the following condition:
- The Prometheus (
TidbMonitor) component in each Kubernetes cluster has access to the Thanos Receiver component.
For the deployment instructions of Thanos Receiver, refer to kube-thanos and the example.
Architecture
Deploy TidbMonitor
According to the Kubernetes cluster that the TiDB cluster is deployed in, set the following environment variables:
cluster_name: the TiDB cluster name.cluster_namespace: the TiDB cluster namespace.kubernetes_cluster_name: the custom Kubernetes cluster name, which is used in theexternallabelsof Prometheus.storageclass_name: the storage of the current Kubernetes cluster.remote_write_url: the host of thethanos-receivercomponent, or the host of other components compatible with the Prometheus remote write API.
```shell
cluster_name="cluster1"
cluster_namespace="pingcap"
kubernetes_cluster_name="kind-cluster-1"
storageclass_name="local-storage"
remote_write_url="http://thanos-receiver:19291/api/v1/receive"
```
- Create a
TidbMonitorcomponent by running the following command:
```shell
cat << EOF | kubectl apply -n ${cluster_namespace} -f -
apiVersion: pingcap.com/v1alpha1
kind: TidbMonitor
metadata:
  name: ${cluster_name}
spec:
  clusters:
  - name: ${cluster_name}
    namespace: ${cluster_namespace}
  externalLabels:
    # k8s_cluster indicates the k8s cluster name, you can change
    # the label's name on your own, but you should notice that the
    # "cluster" label has been used by the TiDB metrics already.
    # For more information, please refer to the issue
    # https://github.com/pingcap/tidb-operator/issues/4219.
    k8s_cluster: ${kubernetes_cluster_name}
    # add other meta labels here
    #region: us-east-1
  initializer:
    baseImage: pingcap/tidb-monitor-initializer
    version: v5.4.0
  persistent: true
  storage: 100Gi
  storageClassName: ${storageclass_name}
  prometheus:
    baseImage: prom/prometheus
    logLevel: info
    remoteWrite:
    - url: ${remote_write_url}
    retentionTime: 2h
    version: v2.27.1
  reloader:
    baseImage: pingcap/tidb-monitor-reloader
    version: v1.0.1
  imagePullPolicy: IfNotPresent
EOF
```
Pull data from Prometheus
The pull method pulls monitoring data from Prometheus instances in different Kubernetes clusters and aggregates the data into a global view. This section describes how to pull data using Thanos Query and using Prometheus Federation.
- Thanos Query
- Federation
Using Thanos Query
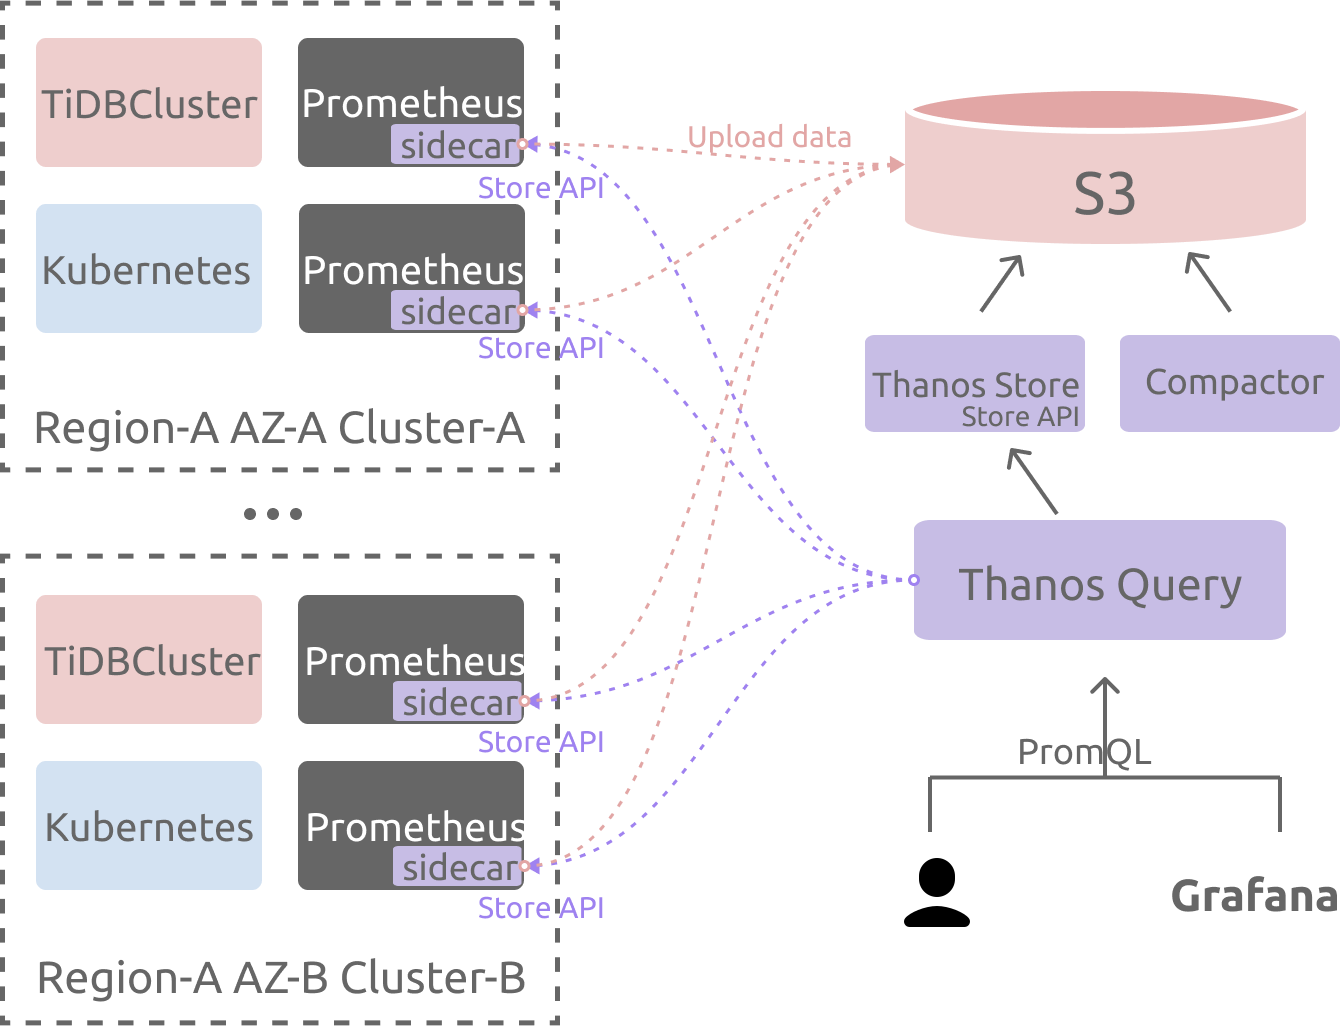
In the example of this section, one Thanos Sidecar is deployed for each Prometheus (TidbMonitor) component. The Thanos query component is used for aggregation queries. If you do not need long-term storage, you can skip the deployment of some components such as thanos-store and S3.
Prerequisites
You need to configure the network and DNS of the Kubernetes clusters so that the Kubernetes clusters meet the following conditions:
- The Thanos Query component has access to the Pod IP of the Prometheus (
TidbMonitor) component in each Kubernetes cluster. - The Thanos Query component has access to the Pod FQDN of the Prometheus (
TidbMonitor) component in each Kubernetes cluster.
For the deployment instructions of Thanos Query, refer to kube-thanos and the example.
Architecture
Deploy TidbMonitor
According to the Kubernetes cluster that the TiDB cluster is deployed in, set the following environment variables:
cluster_name: the TiDB cluster name.cluster_namespace: the TiDB cluster namespace.kubernetes_cluster_name: the custom Kubernetes cluster name, which is used in theexternallabelsof Prometheus.cluster_domain: the current cluster's cluster domain.storageclass_name: the storage of the current Kubernetes cluster.
```shell
cluster_name="cluster1"
cluster_namespace="pingcap"
kubernetes_cluster_name="kind-cluster-1"
storageclass_name="local-storage"
cluster_domain="svc.local"
```
- Create a
TidbMonitorcomponent by running the following command:
```shell
cat <<EOF | kubectl apply -n ${cluster_namespace} -f -
apiVersion: pingcap.com/v1alpha1
kind: TidbMonitor
metadata:
  name: ${cluster_name}
spec:
  clusters:
  - name: ${cluster_name}
    namespace: ${cluster_namespace}
  externalLabels:
    # k8s_cluster indicates the k8s cluster name, you can change
    # the label's name on your own, but you should notice that the
    # "cluster" label has been used by the TiDB metrics already.
    # For more information, please refer to the issue
    # https://github.com/pingcap/tidb-operator/issues/4219.
    k8s_cluster: ${kubernetes_cluster_name}
    # add other meta labels here
    #region: us-east-1
  initializer:
    baseImage: pingcap/tidb-monitor-initializer
    version: v5.4.0
  persistent: true
  storage: 20Gi
  storageClassName: ${storageclass_name}
  prometheus:
    baseImage: prom/prometheus
    logLevel: info
    version: v2.27.1
  reloader:
    baseImage: pingcap/tidb-monitor-reloader
    version: v1.0.1
  thanos:
    baseImage: quay.io/thanos/thanos
    version: v0.22.0
    #enable config below if long-term storage is needed.
    #objectStorageConfig:
    #  key: objectstorage.yaml
    #  name: thanos-objectstorage
  imagePullPolicy: IfNotPresent
EOF
```
Configure Thanos Query Stores:
You can specify the store nodes by the static service discovery method. In the Thanos Query command line's starting parameters, add
--store=${cluster_name}-prometheus.${cluster_namespace}.svc.${cluster_domain}:10901to specify the store node. Replace the variables with the actual values.If you use other service discovery methods, refer to thanos-service-discovery.
Using Prometheus Federation
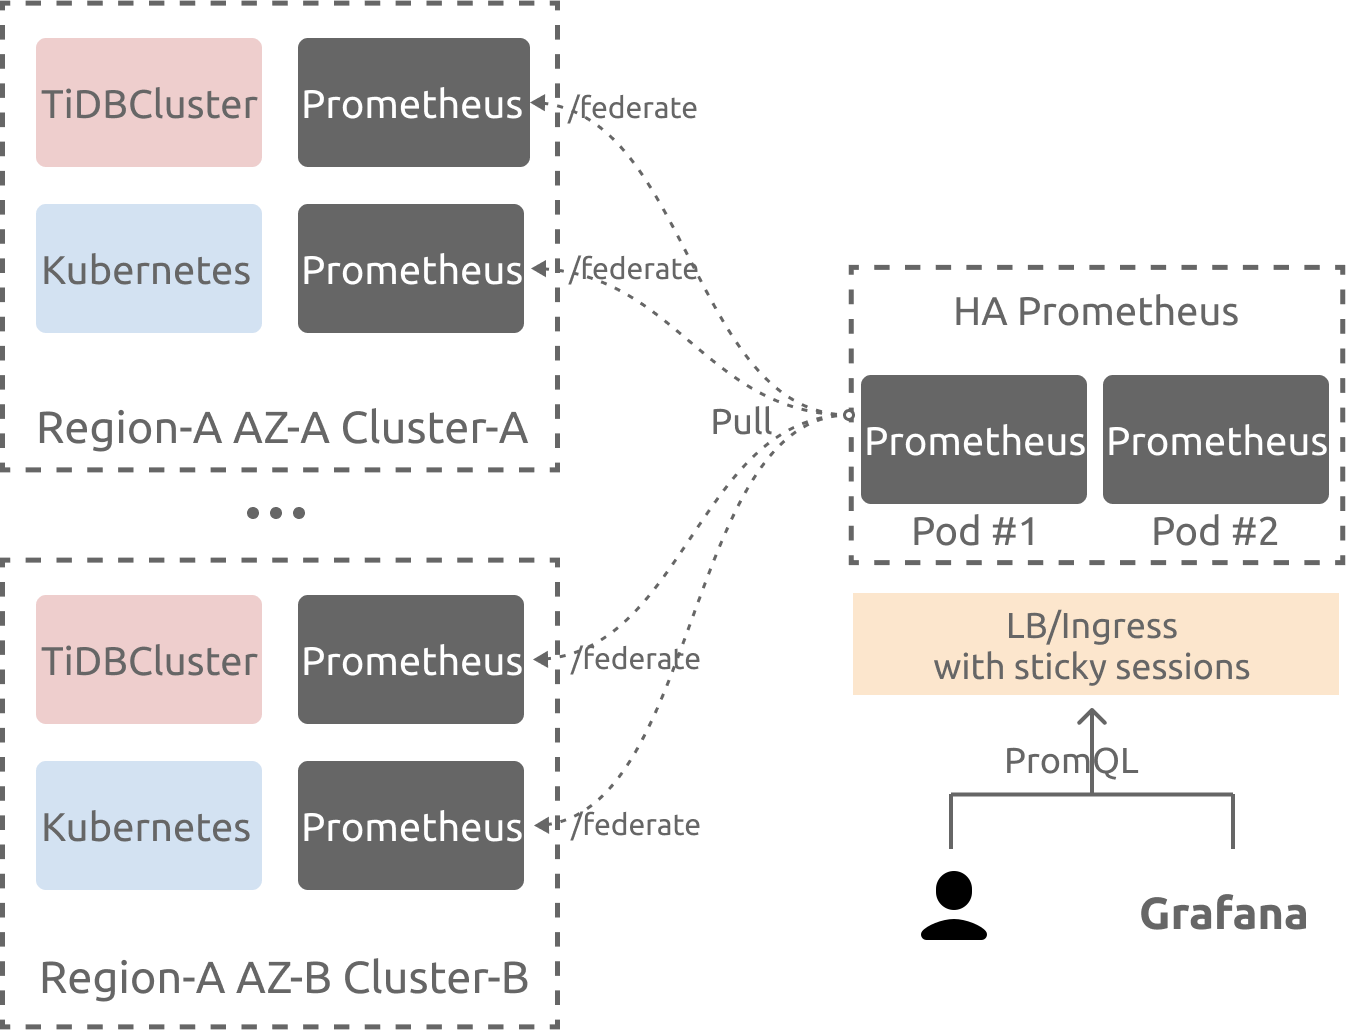
In the example of this section, the Federation Prometheus server is used as an entry point for unified storage and query. This method is only considered for small data volumes.
Prerequisites
You need to configure the network and DNS of the Kubernetes clusters so that the Kubernetes clusters meet the following conditions:
- The Federation Prometheus component has access to the Pod IP of the Prometheus (
TidbMonitor) component in each Kubernetes cluster. - The Federation Prometheus component has access to the Pod FQDN of the Prometheus (
TidbMonitor) component in each Kubernetes cluster.
Architecture
Deploy TidbMonitor
According to the Kubernetes cluster that the TiDB cluster is deployed in, set the following environment variables:
cluster_name: the TiDB cluster name.cluster_namespace: the TiDB cluster namespace.kubernetes_cluster_name: the custom Kubernetes cluster name, which is used in theexternallabelsof Prometheus.storageclass_name: the storage of the current Kubernetes cluster.
```shell
cluster_name="cluster1"
cluster_namespace="pingcap"
kubernetes_cluster_name="kind-cluster-1"
storageclass_name="local-storage"
```
- Create a
TidbMonitorcomponent by running the following command:
```shell
cat << EOF | kubectl apply -n ${cluster_namespace} -f -
apiVersion: pingcap.com/v1alpha1
kind: TidbMonitor
metadata:
  name: ${cluster_name}
spec:
  clusters:
  - name: ${cluster_name}
    namespace: ${cluster_namespace}
  externalLabels:
    # k8s_cluster indicates the k8s cluster name, you can change
    # the label's name on your own, but you should notice that the
    # "cluster" label has been used by the TiDB metrics already.
    # For more information, please refer to the issue
    # https://github.com/pingcap/tidb-operator/issues/4219.
    k8s_cluster: ${kubernetes_cluster_name}
    # add other meta labels here
    #region: us-east-1
  initializer:
    baseImage: pingcap/tidb-monitor-initializer
    version: v5.4.0
  persistent: true
  storage: 20Gi
  storageClassName: ${storageclass_name}
  prometheus:
    baseImage: prom/prometheus
    logLevel: info
    version: v2.27.1
  reloader:
    baseImage: pingcap/tidb-monitor-reloader
    version: v1.0.1
  imagePullPolicy: IfNotPresent
EOF
```
Configure Federation Prometheus
For details on Federation, refer to Federation. After the deployment of Prometheus, you need to modify the Prometheus configuration, and add the host information of the Prometheus (TidbMonitor) to be aggregated.
scrape_configs:
  - job_name: 'federate'
    scrape_interval: 15s

    honor_labels: true
    metrics_path: '/federate'

    params:
      'match[]':
        - '{__name__=~".+"}'

    static_configs:
      - targets:
        - 'source-prometheus-1:9090'
        - 'source-prometheus-2:9090'
        - 'source-prometheus-3:9090'
Visualize monitoring data using Grafana
After collecting data using Prometheus, you can visualize multi-cluster monitoring data using Grafana.
- Obtain the Grafana dashboard configuration files related to TiDB components by running the following command:
```shell
# set tidb version here
version=v6.1.0
docker run --rm -i -v ${PWD}/dashboards:/dashboards/ pingcap/tidb-monitor-initializer:${version} && \
cd dashboards
```

> **Note:**
>
> In the command above, `${version}` is the version of the Initializer image, which should be consistent with the TiDB version. Currently, only `v6.0.0` and later versions of the Initializer image support **multiple Kubernetes clusters** monitoring.

After running the command above, you can view all the dashboard JSON files in the current directory.
Refer to the Grafana documentation to configure the Prometheus data source.
To keep the configuration consistent with the dashboard JSON files obtained in the previous step, you need to set the
Namefield of the data source totidb-cluster. If you want to use the existing data source, run the following command to replace the data source name in the dashboard JSON files. In the command,$DS_NAMEis the name of the data source.
```shell
# define your datasource name here.
DS_NAME=thanos
sed -i 's/"datasource": "tidb-cluster"/"datasource": "$DS_NAME"/g' *.json
```
- Refer to the Grafana documentation to import dashboards into Grafana.