TiDB Performance Tuning Overview
This document introduces the basic concepts of performance tuning, such as user response time, throughput, and database time, and also provides a general process for performance tuning.
User response time and database time
User response time
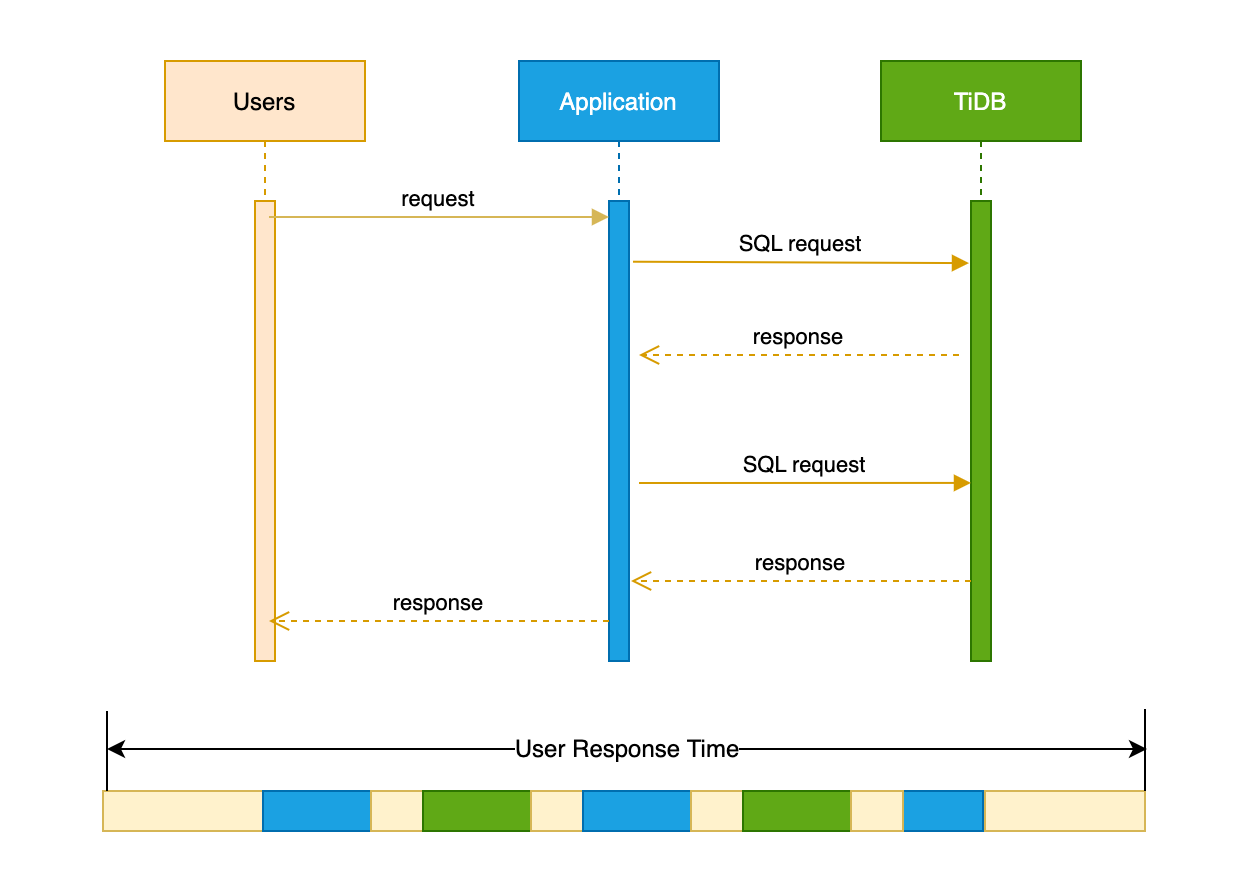
User response time indicates how long an application takes to return the results of a request to users. As you can see from the following sequential timing diagram, the time of a typical user request contains the following:
- The network latency between the user and the application
- The processing time of the application
- The network latency during the interaction between the application and the database
- The service time of the database
The user response time is affected by various subsystems on the request chain, such as network latency and bandwidth, number and request types of concurrent users, and resource usage of server CPU and I/O. To optimize the entire system effectively, you need to first identify the bottlenecks in user response time.
To get a total user response time within a specified time range (ΔT), you can use the following formula:
Total user response time in ΔT = Average TPS (Transactions Per Second) x Average user response time x ΔT.
Database time
Database time indicates the total service time provided by a database. The database time in ΔT is the sum of the time that a database takes to process all application requests concurrently.
To get the database time, you can use any of the following methods:
- Method 1: Multiply the average query latency by QPS and by ΔT, that is,
DB Time in ΔT = QPS × avg latency × ΔT - Method 2: Multiply the average number of active sessions by ΔT, that is,
DB Time in ΔT = avg active connections × ΔT - Method 3: Calculate the time based on the TiDB internal Prometheus metric TiDB_server_handle_query_duration_seconds_sum, that is.
ΔT DB Time = rate(TiDB_server_handle_query_duration_seconds_sum) × ΔT
Relationship between user response time and system throughput
User response time consists of service time, queuing time, and concurrent waiting time to complete a user request.
User Response time = Service time + Queuing delay + Coherency delay
- Service time: the time a system consumes on certain resources when processing a request, for example, the CPU time that a database consumes to complete a SQL request.
- Queuing delay: the time a system waits in a queue for service of certain resources when processing a request.
- Coherency delay: the time a system communicates and collaborates with other concurrent tasks, so that it can access shared resources when processing a request.
System throughput indicates the number of requests that can be completed by a system per second. User response time and throughput are usually inverse of each other. When the throughput increases, the system resource utilization and the queuing latency for a requested service increase accordingly. Once resource utilization exceeds a certain inflection point, the queuing latency will increase dramatically.
For example, for a database system running OLTP loads, after its CPU utilization exceeds 65%, the CPU queueing scheduling latency increases significantly. This is because concurrent requests of a system are not completely independent, which means that these requests can collaborate and compete for shared resources. For example, requests from different users might perform mutually exclusive locking operations on the same data. When the resource utilization increases, the queuing and scheduling latency increases too, which causes that the shared resources cannot be released in time and in turn prolongs the waiting time for shared resources by other tasks.
Performance tuning process
The performance tuning process consists of the following 6 steps:
- Define a tuning objective.
- Establish a performance baseline.
- Identify bottlenecks in user response time.
- Propose tuning solutions, and evaluate the benefits, risks, and costs of each solution.
- Implement tuning solutions.
- Evaluate tuning results.
To achieve the tuning objective of a performance tuning project, you usually need to repeat Step 2 to Step 6 multiple times.
Step 1. Define a tuning objective
For different types of systems, tuning objectives are different too. For example, for a financial core OLTP system, the tuning objective might be to reduce the long-tail latency of transactions; for a financial settlement system, the tuning objective might be to make better use of hardware resources and reduce the time of batch settlement tasks.
A good tuning objective should be easily quantifiable. For example:
- Good tuning objective: The p99 latency for transfer transactions needs to be less than 200 ms during peak business hours of 9 am to 10 am.
- Poor tuning objective: The system is too slow to respond so it needs to be optimized.
Defining a clear tuning objective helps guide the subsequent performance tuning steps.
Step 2. Establish a performance baseline
To tune performance efficiently, you need to capture the current performance data to establish a performance baseline. The performance data to be captured typically includes the following:
Mean and long-tail values of user response time, and throughput of your application
Database performance data such as database time, query latency, and QPS
TiDB measures and stores performance data thoroughly in different dimensions, such as slow query logs, Top SQL, Continuous Performance Profiling, and traffic visualizer. In addition, you can perform historical backtracking and comparison of the timing metrics data stored in Prometheus.
Resource utilization, including resources such as CPU, IO, and network
Configuration information, such as application configurations, database configurations, and operating system configurations
Step 3. Identify bottlenecks in user response time
Identify or speculate on bottlenecks in user response times based on data from the performance baseline.
Applications usually do not measure and record the full chain of user requests, so you cannot effectively break down user response time from top to bottom through the application.
In contrast, databases have a complete record of performance metrics such as query latency and throughput. Based on database time, you can determine if the bottleneck in user response time is in a database.
- If the bottleneck is not in databases, you need to rely on the resource utilization collected outside databases or profile the application to identify the bottleneck outside databases. Common scenarios include insufficient resources of an application or proxy server, and insufficient usage of hardware resources caused by serial points in an application.
- If bottlenecks are in databases, you can analyze and diagnose the database performances using comprehensive tuning tools. Common scenarios include the presence of slow SQL, unreasonable usage of a database by an application, and the presence of read and write hotspots in databases.
For more information about the analysis and diagnostic methods and tools, see Performance Analysis and Tuning.
Step 4. Propose tuning solutions, and evaluate the benefits, risks, and costs of each solution
After identifying the bottleneck of a system through performance analysis, you can propose a tuning solution that is cost-effective, has low risks, and provides the maximum benefit based on the actual situation.
According to Amdahl's Law, the maximum gain from performance tuning depends on the percentage of the optimized part in the overall system. Therefore, you need to identify the system bottlenecks and the corresponding percentage based on the performance data, and then predict the gains after the bottleneck is resolved or optimized.
Note that even if a solution can bring the greatest potential benefits by tunning the largest bottleneck, you still need to evaluate the risks and costs of this solution. For example:
- The most straightforward tuning objective solution for a resource-overloaded system is to expand its capacity, but in practice, the expansion solution might be too costly to be adopted.
- When a slow query in a business module causes a slow response of the entire module, upgrading to a new version of the database can solve the slow query issue, but it might also affect modules that did not have this issue. Therefore, this solution might have a potentially high risk. A low-risk solution is to skip the database version upgrade and rewrite the existing slow queries for the current database version.
Step 5. Implement tuning solutions
Considering the benefits, risks, and costs, choose one or more tuning solutions for implementation. In the implementation process, you need to make thorough preparation for changes to the production system and record the changes in detail.
To mitigate risks and validate the benefits of a tuning solution, it is recommended that you perform validation and complete regression of changes in both test and staging environments. For example, if the selected tuning solution of a slow query is to create a new index to optimize the query access path, you need to ensure that the new index does not introduce any obvious write hotspots to the existing data insertion workload and slows down other modules.
Step 6. Evaluate tuning results
After applying the tuning solution, you need to evaluate the results:
- If the tuning objective is reached, the entire tuning project is completed successfully.
- If the tuning objective is not reached, you need to repeat Step 2 to Step 6 in this document until the tuning objective is reached.
After reaching your tuning objectives, you might need to further plan your system capacity to meet your business growth.