Quick Start Guide for PingCAP Clinic
This document describes how to use PingCAP Clinic diagnosis service (PingCAP Clinic) to collect, upload, and view cluster diagnosis data quickly.
PingCAP Clinic consists of two components: Diag client (shorten as Diag) and Clinic Server cloud service (shorten as Clinic Server). For details of these two components, refer to PingCAP Clinic Overview.
User scenarios
- To accurately identify and quickly resolve problems in your cluster when seeking help remotely from PingCAP technical support, you can collect diagnostic data with Diag, upload the collected data to the Clinic Server, and provide the data access link to the technical support.
- When the cluster is running properly and you need to check the status of the cluster, you can use Diag to collect diagnostic data, upload the data to Clinic Server, and view the results of Health Report.
Prerequisites
Before using PingCAP Clinic, you need to install Diag and prepare an environment for uploading data.
On your control machine with TiUP installed, run the following command to install Diag:
tiup install diagLog in to Clinic Server.
Go to the Clinic Server for international users and select Sign in with TiDB Account to enter the TiDB Cloud login page. If you do not have a TiDB Cloud account, create one on that page.
Go to the Clinic Server for users in the Chinese mainland and select Sign in with AskTUG to enter the AskTUG community login page. If you do not have an AskTUG account, create one on that page
Create an organization on the Clinic Server. Organization is a collection of TiDB clusters. You can upload diagnostic data on the created organization.
Get an access token to upload data. When uploading collected data through Diag, you need a token for user authentication to ensure the data is isolated securely. If you already get a token from the Clinic Server, you can reuse the token.
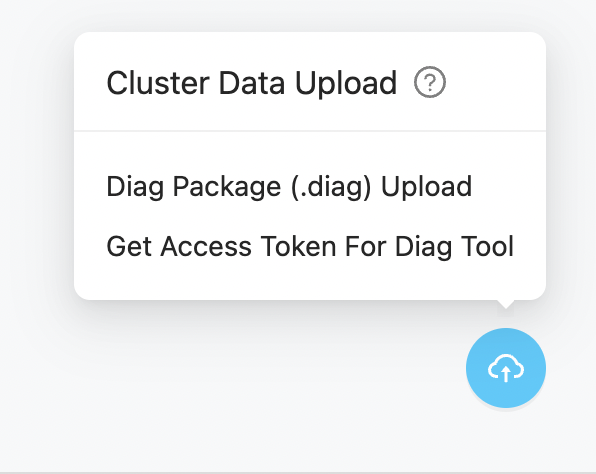
To get a token, click the icon in the lower-right corner of the Cluster page, select Get Access Token For Diag Tool, and click + in the pop-up window. Make sure that you have copied and saved the token that is displayed.
Set the token and
regionin Diag.Run the following command to set the
clinic.token:tiup diag config clinic.token ${token-value}Run the following command to set the
clinic.region:
regiondetermines the encryption certificate used for packing data and the target service when uploading the data. For example:When using Clinic Server for international users, set
regiontoUSusing the following command:tiup diag config clinic.region USWhen using Clinic Server for users in the Chinese mainland, set
regiontoCNusing the following command:tiup diag config clinic.region CN(Optional) Enable log redaction.
When TiDB provides detailed log information, it might print sensitive information (for example, user data) in the log. If you want to avoid leaking sensitive information in the local log and Clinic Server, you can enable log redaction in the TiDB side. For more information, see log redaction.
Steps
Run Diag to collect diagnostic data.
For example, to collect the diagnostic data from 4 hours ago to 2 hours ago based on the current time, run the following command:
tiup diag collect ${cluster-name} -f="-4h" -t="-2h"After you run the command, Diag does not start collecting data immediately. Instead, Diag provides the estimated data size and the target data storage path in the output for you to confirm whether to continue. To confirm that you want to start collecting data, enter
Y.After the collection is complete, Diag provides the folder path where the collected data is located.
Upload the collected data to Clinic Server.
- If the network where your cluster is located can access the internet, you can directly upload the folder with collected data using the following command:
    ```bash
    tiup diag upload ${filepath}
    ```

    After the upload is completed, the `Download URL` is displayed in the output.

    > **Note:**
    >
    > When uploading data using this method, you need to use Diag v0.9.0 or a later version. You can get the Diag version when you run it. If the Diag version is earlier than 0.9.0, you can use the `tiup update diag` command to upgrade Diag to the latest version.

- If the network where your cluster is located cannot access the internet, you need to pack the collected data and upload the package. For details, see [Method 2. Pack and upload data](/clinic/clinic-user-guide-for-tiup.md#method-2-pack-and-upload-data).
After the upload is complete, get the data access link from
Download URLin the command output.By default, the diagnostic data includes the cluster name, cluster topology information, log content in the collected diagnostic data, and Grafana Dashboard information reorganized based on the metrics in the collected data.
You can use the data to troubleshoot cluster problems by yourself, or you can provide the data access link to PingCAP technical support staff to facilitate the remote troubleshooting.
View the results of Health Report
After data is uploaded, Clinic Server processes the data automatically in the background. The Health Report is generated in approximately 5 to 15 minutes. You can view the report by opening the diagnostic data link and click the "Health Report".