TiDB Dashboard Instance Profiling - Manual Profiling
Manual Profiling allows users to collect current performance data on demand for each TiDB, TiKV, PD and TiFlash instances with a single click. The collected performance data can be visualized as FlameGraph or DAG.
With these performance data, experts can analyze current resource consumption details like instance's CPU and memory, to help pinpoint sophisticated ongoing performance problems, such as high CPU overhead, high memory usage, process stalls, and so on.
After initiates the profiling, TiDB Dashboard collects current performance data for a period of time (30 seconds by default). Therefore this feature can only be used to analyze ongoing problems that the cluster is facing now and has no significant effect on historical problems. If you want to collect and analyze performance data at any time, see Continuous Profiling.
Supported performance data
The following performance data are currently supported:
CPU: The CPU overhead of each internal function on TiDB, TiKV, PD and TiFlash instances
The CPU overhead of TiKV and TiFlash instances is currently not supported in ARM architecture.
Heap: The memory consumption of each internal function on TiDB and PD instances
Mutex: The mutex contention states on TiDB and PD instances
Goroutine: The running state and call stack of all goroutines on TiDB and PD instances
Access the page
You can access the instance profiling page using either of the following methods:
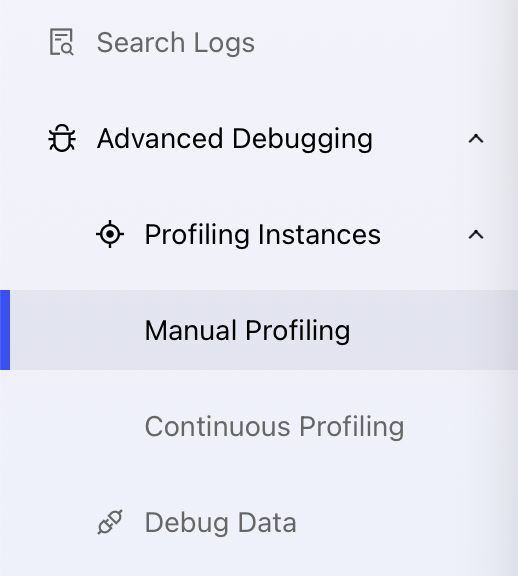
After logging into TiDB Dashboard, click Advanced Debugging > Profiling Instances > Manual Profiling on the left navigation bar.
Visit http://127.0.0.1:2379/dashboard/#/instance_profiling in your browser. Replace
127.0.0.1:2379with the actual PD instance address and port.
Start Profiling
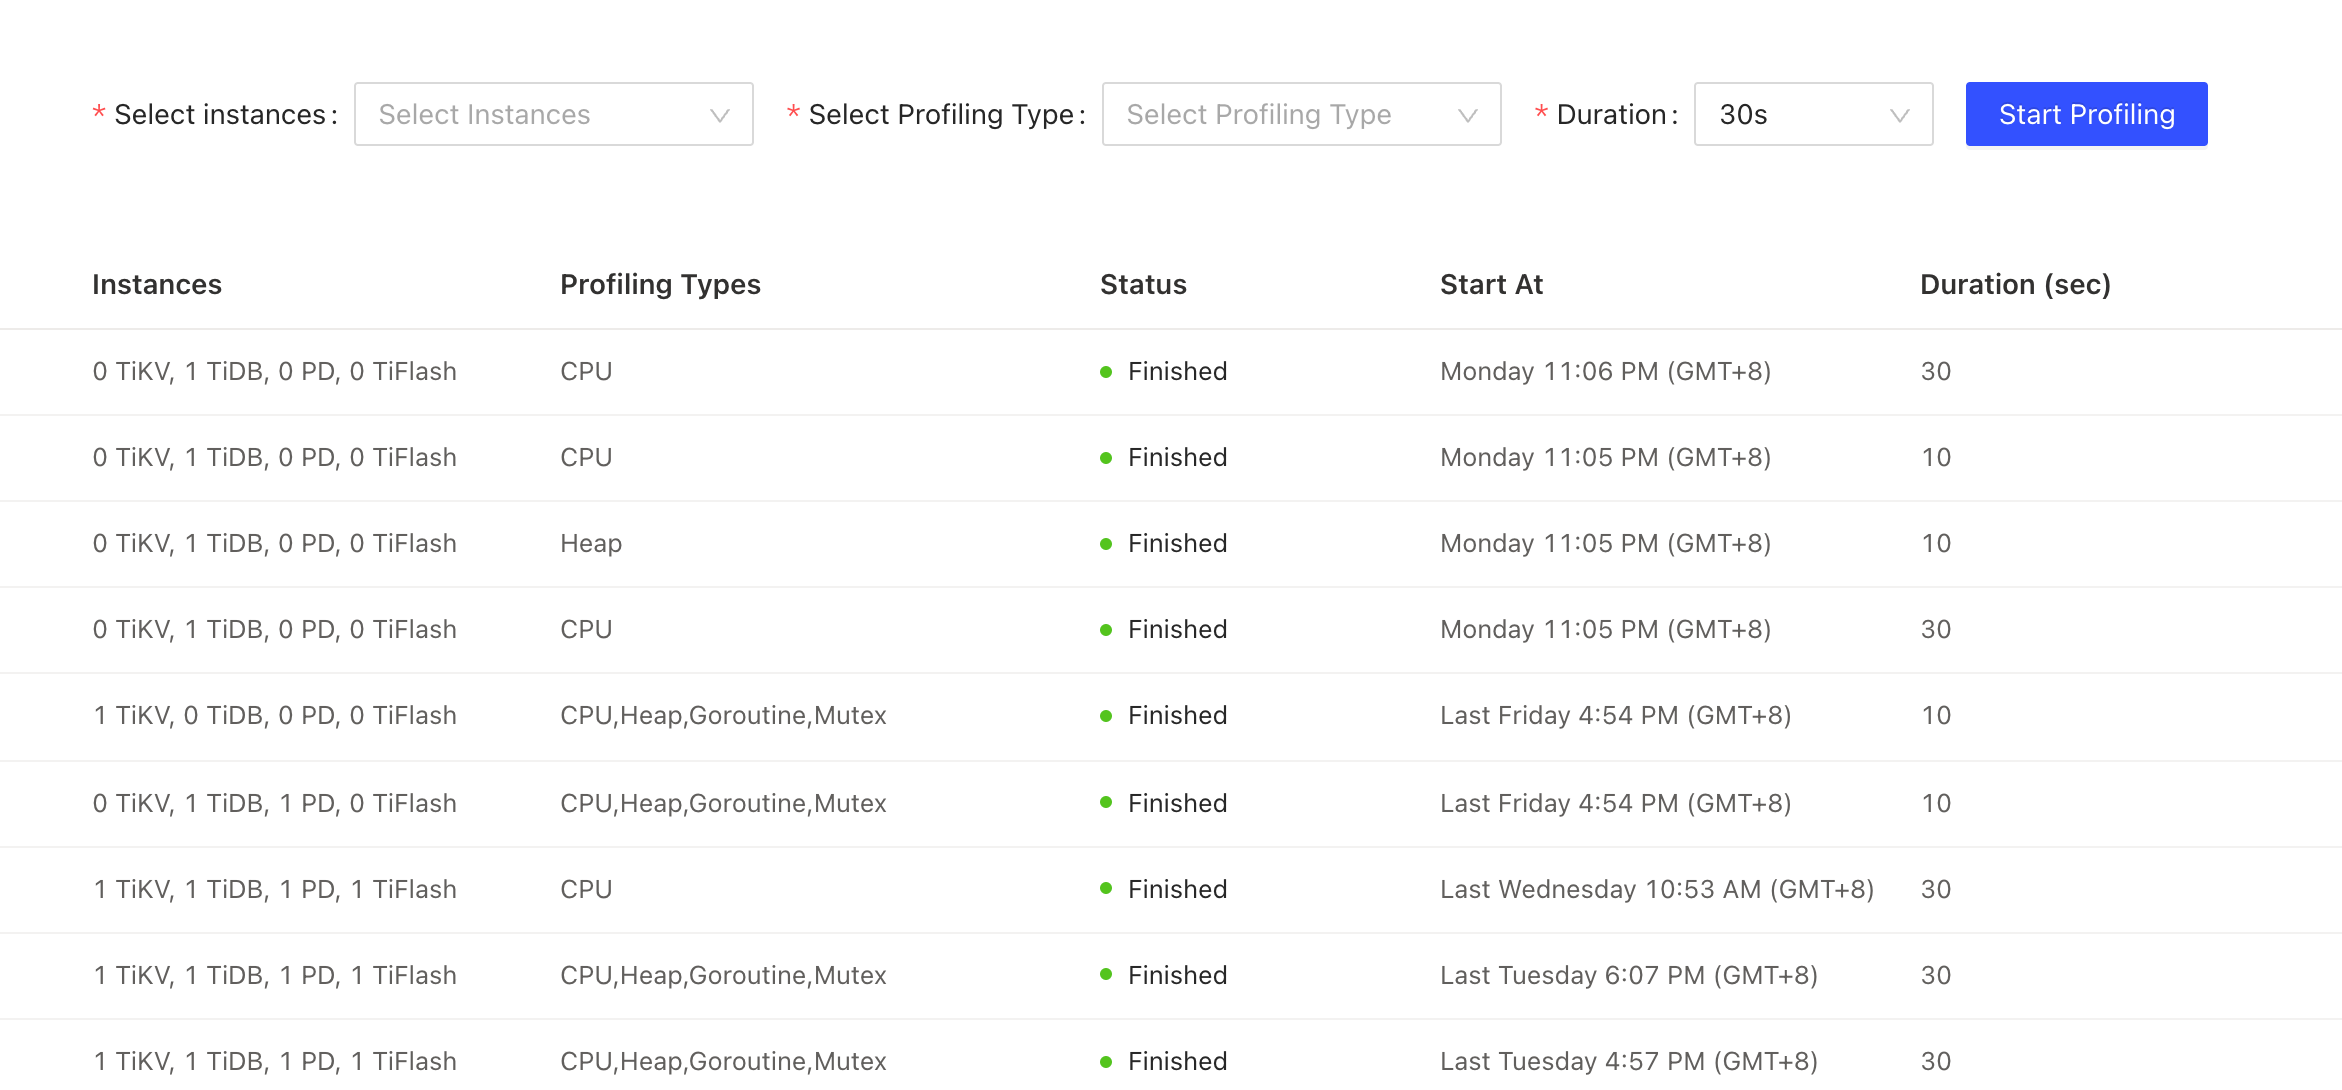
In the instance profiling page, choose at least one target instance and click Start Profiling to start the instance profiling.
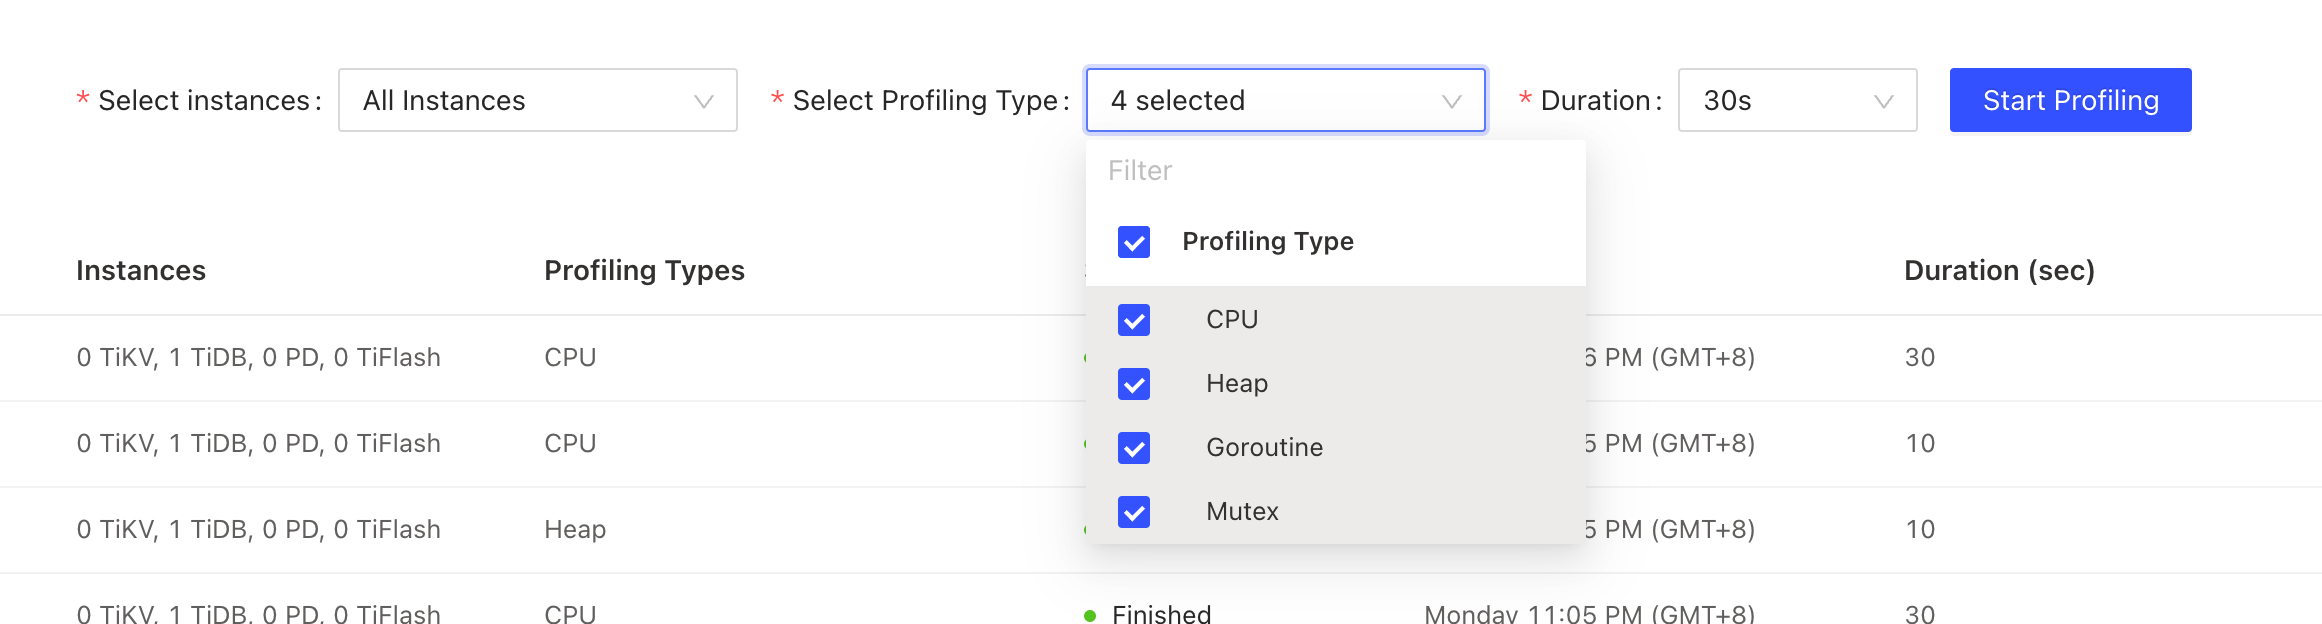
You can modify the profiling duration before starting the profiling. This duration is determined by the time needed for the profiling, which is 30 seconds by default. The 30-second duration takes 30 seconds to complete.
Manual Profiling cannot be initiated on clusters that have Continuous Profiling enabled. To view the performance data at the current moment, click on the most recent profiling result in the Continuous Profiling page.
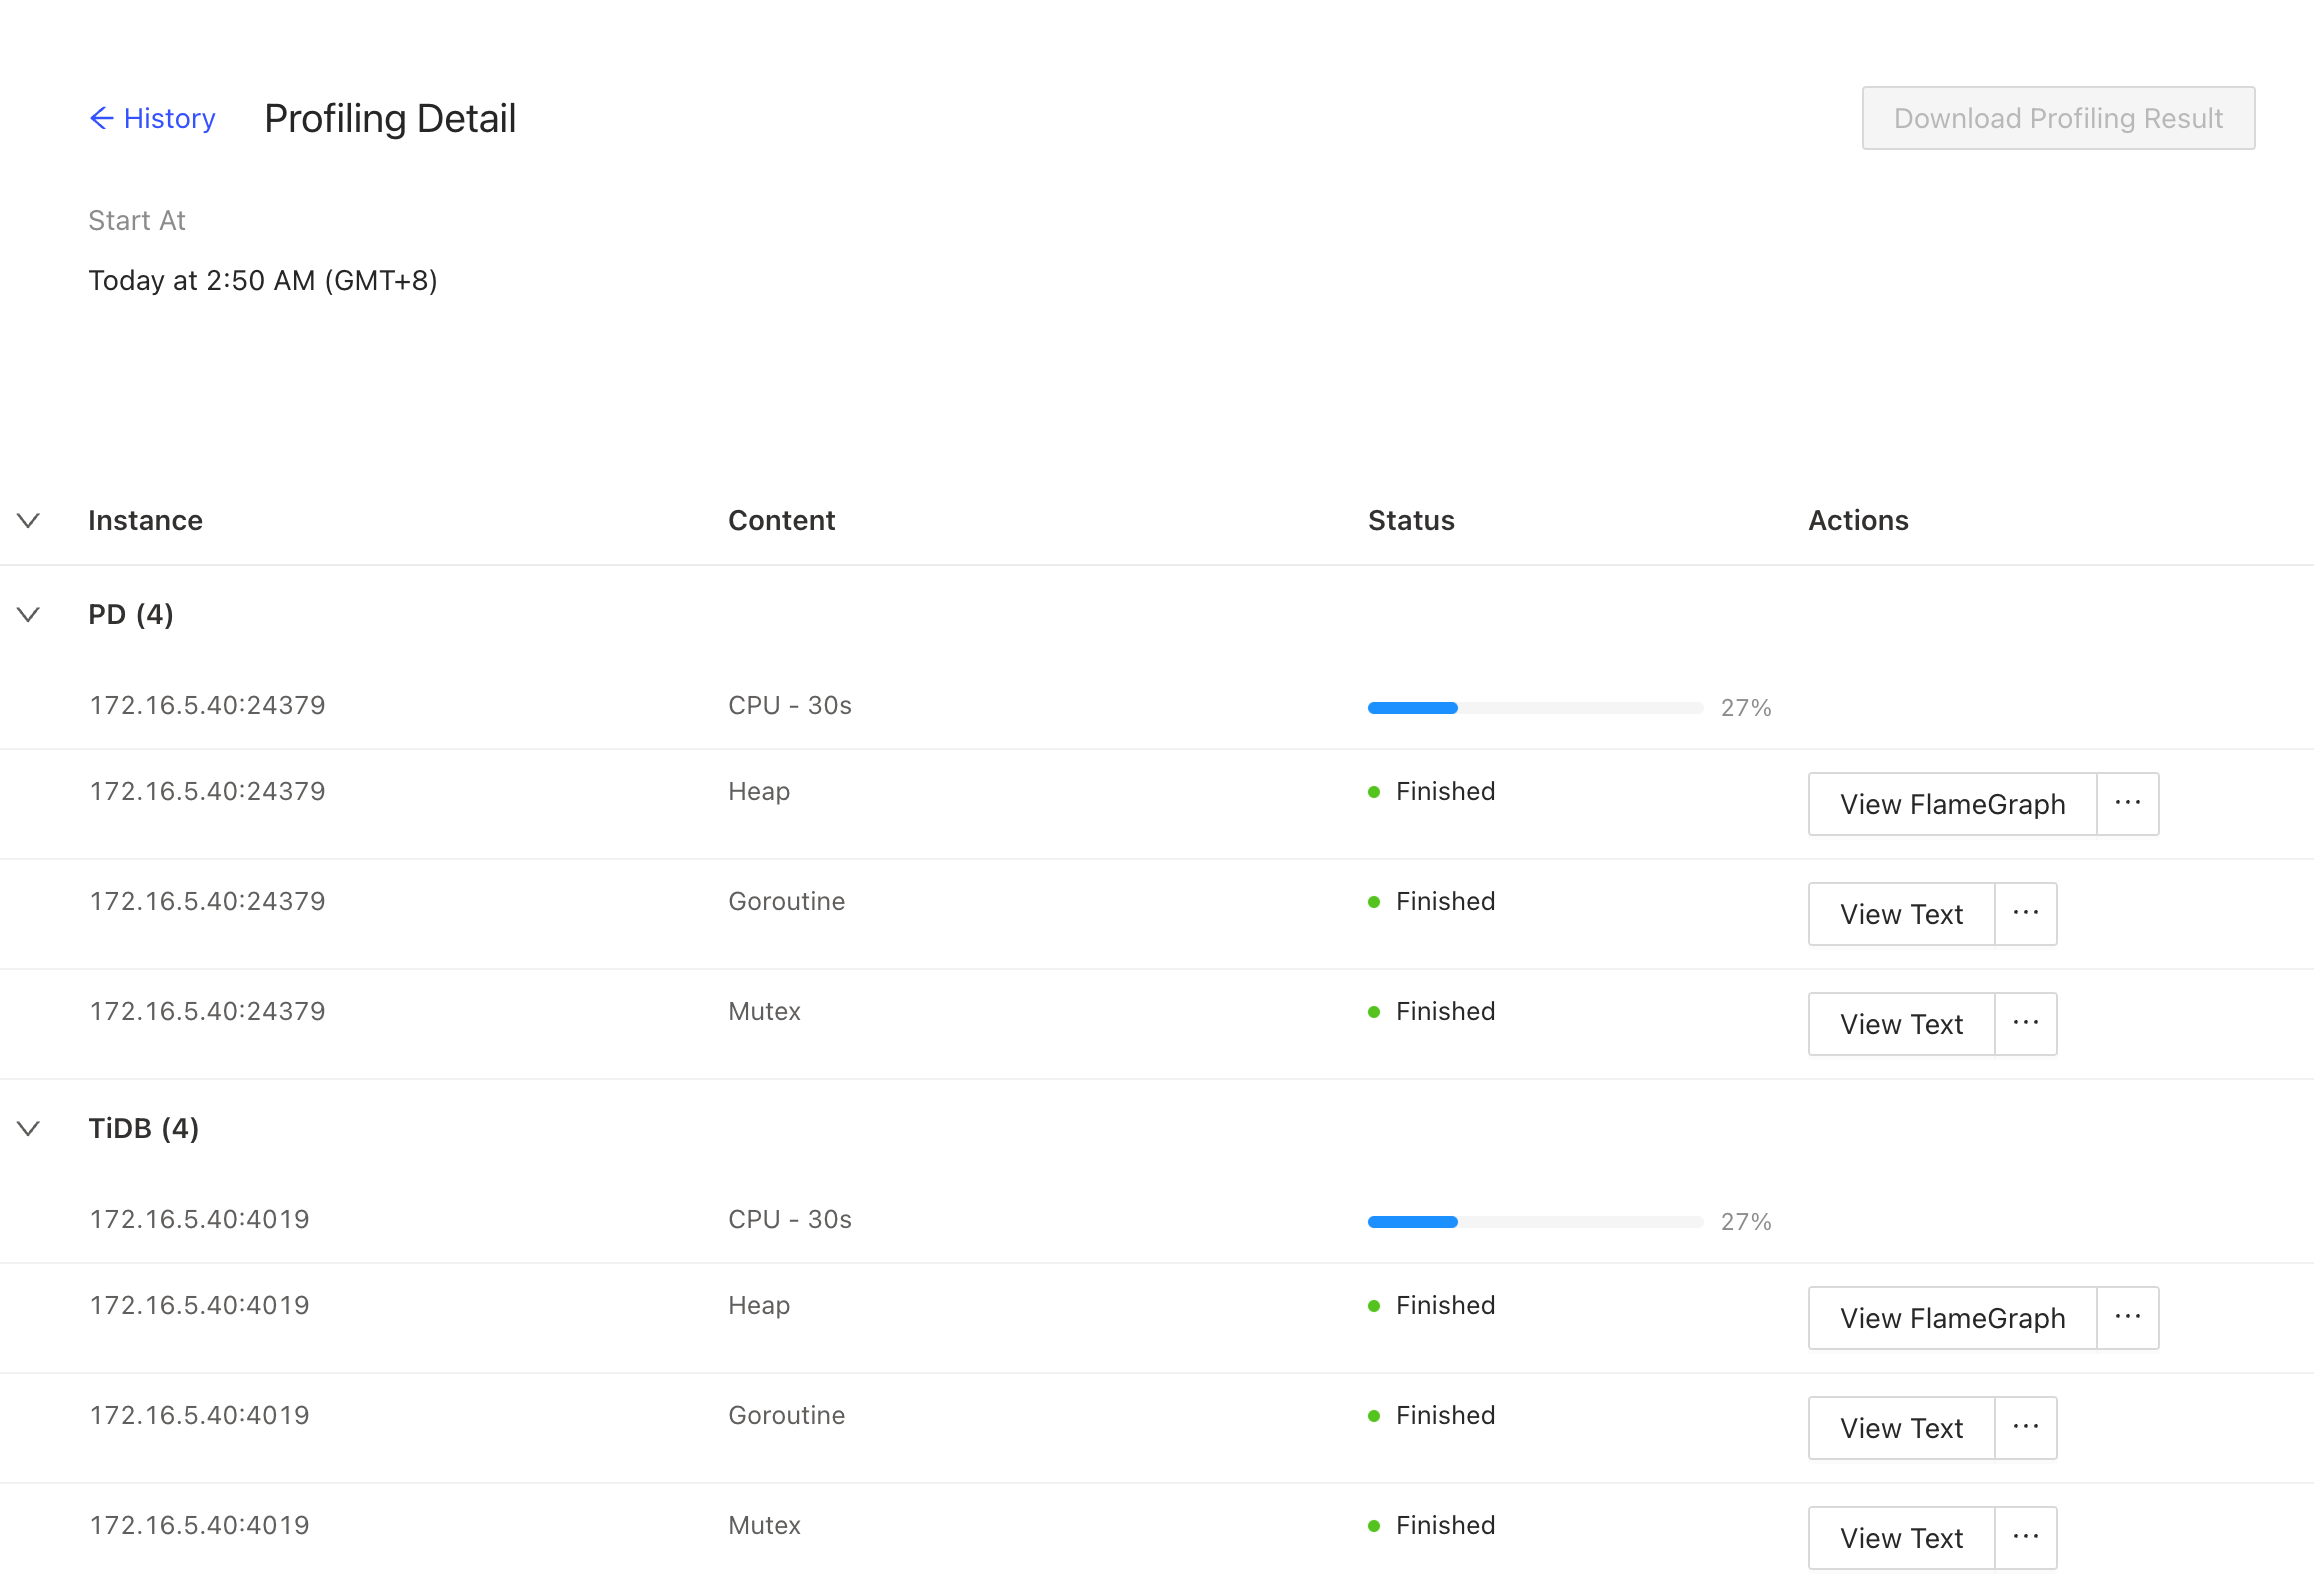
View profiling status
After a profiling is started, you can view the profiling status and progress in real time.
The profiling runs in the background. Refreshing or exiting the current page does not stop the profiling task that is running.
Download performance data
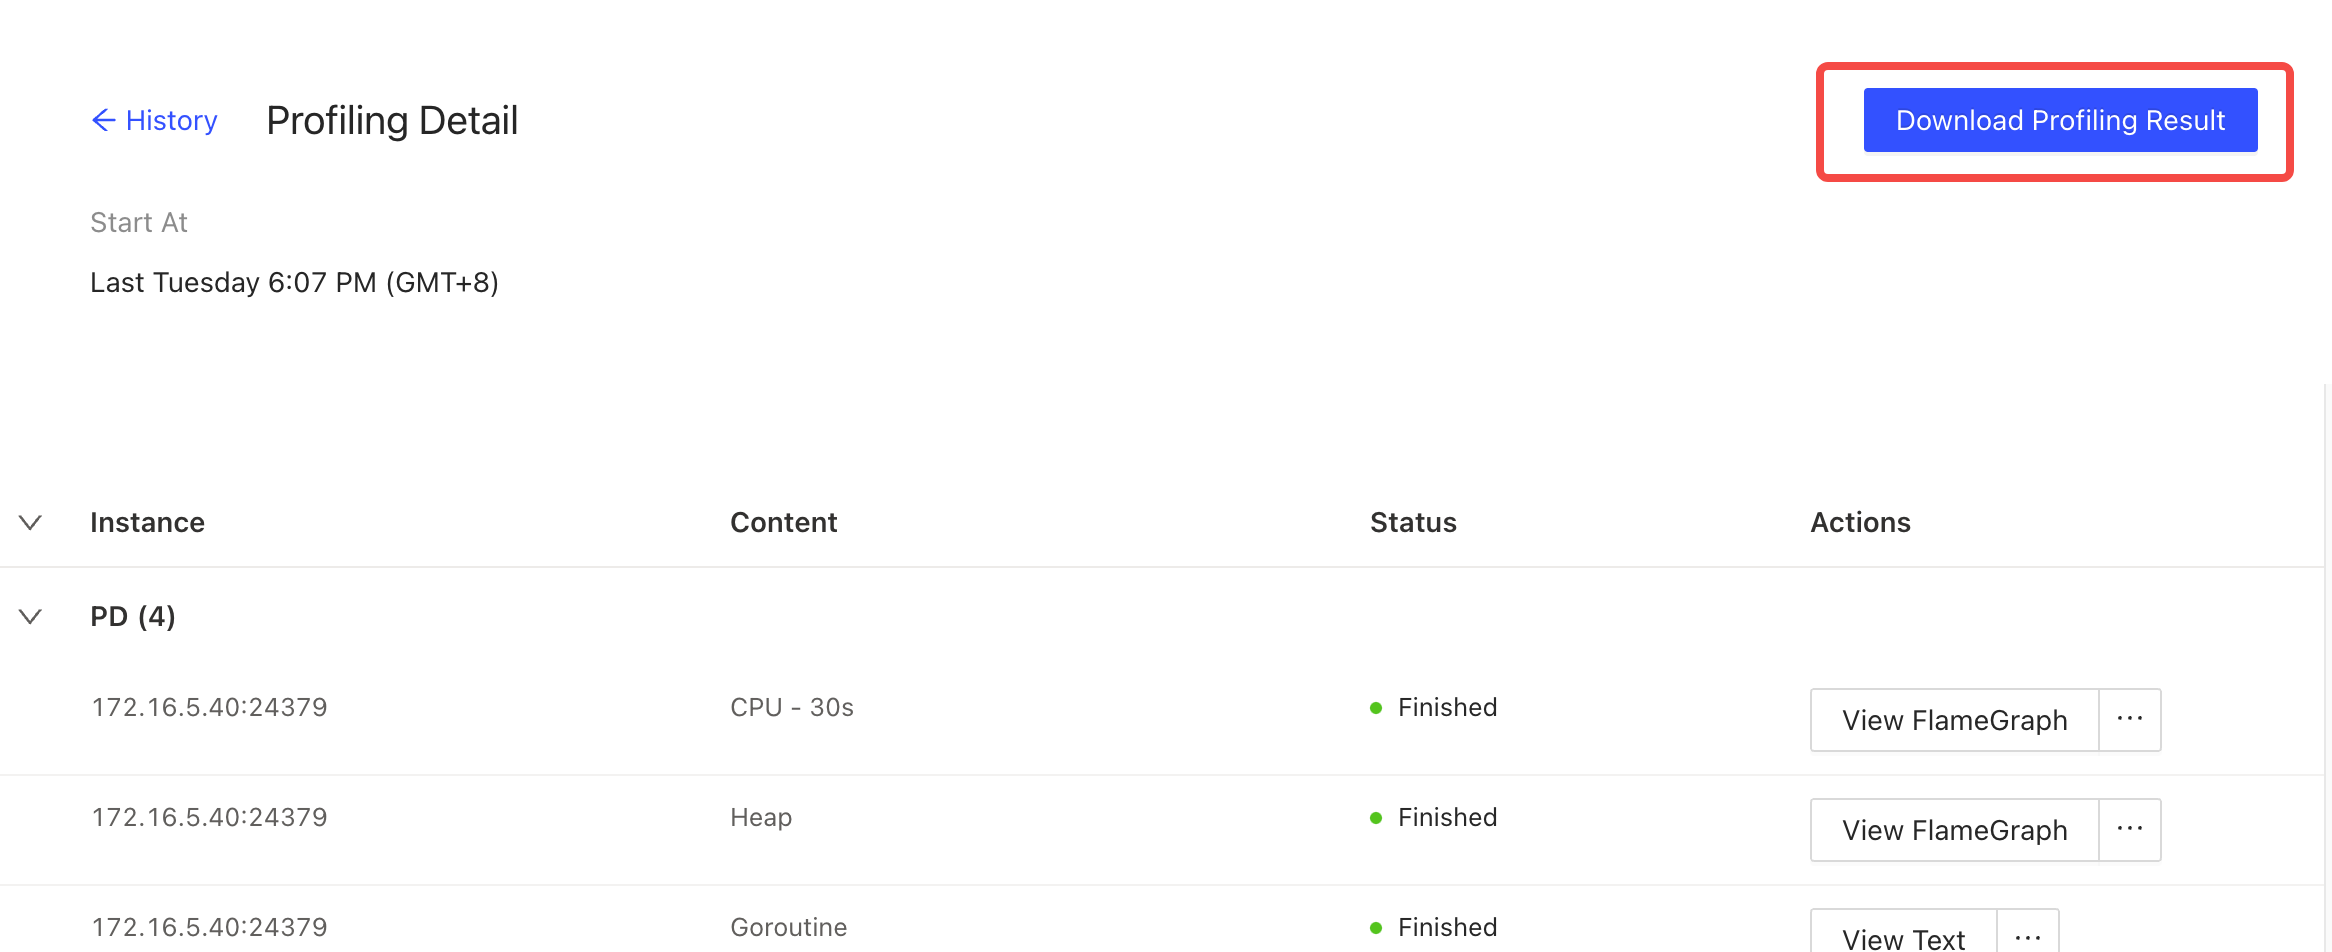
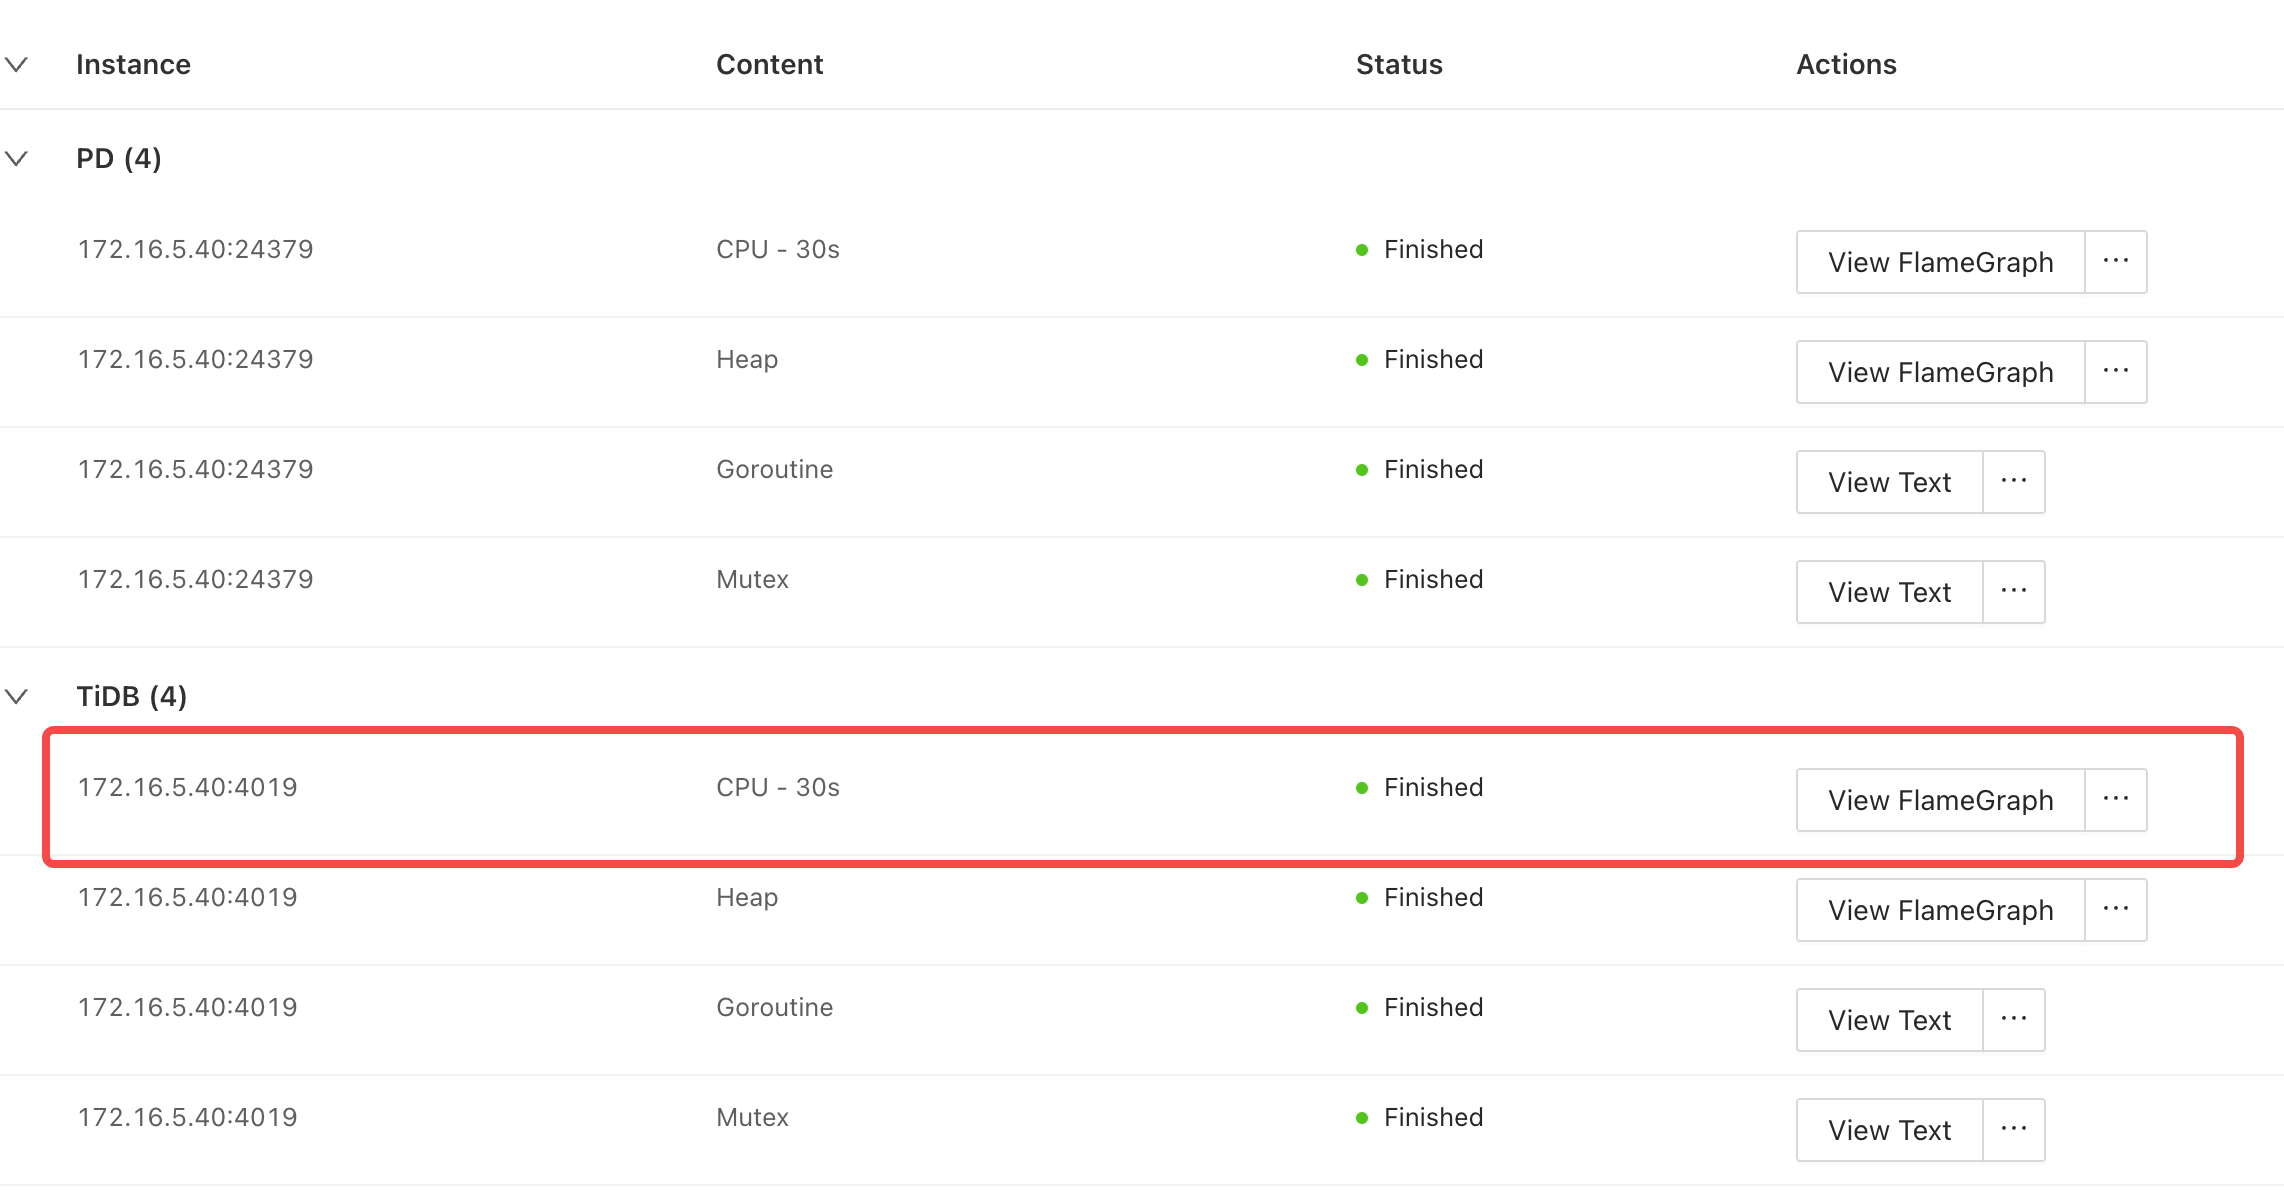
After the profiling of all instances is completed, you can click Download Profiling Result in the upper right corner to download all performance data.
You can also click an individual instance in the table to view its profiling result. Alternatively, you can hover on ... to download raw data.
View profiling history
The on-demand profiling history is listed on the page. Click a row to view details.
For detailed operations on the profiling status page, see View Profiling Status.