TiDB Sysbench Performance Test Report -- v5.2.0 vs. v5.1.1
Test overview
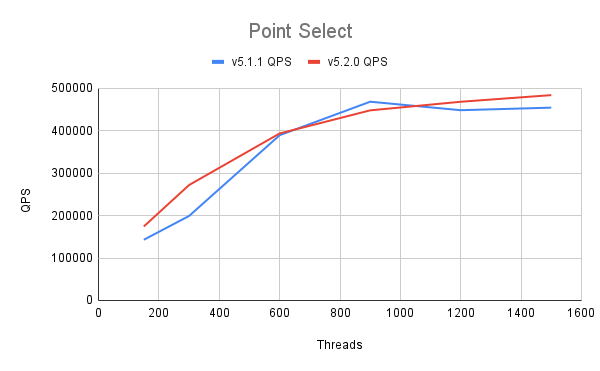
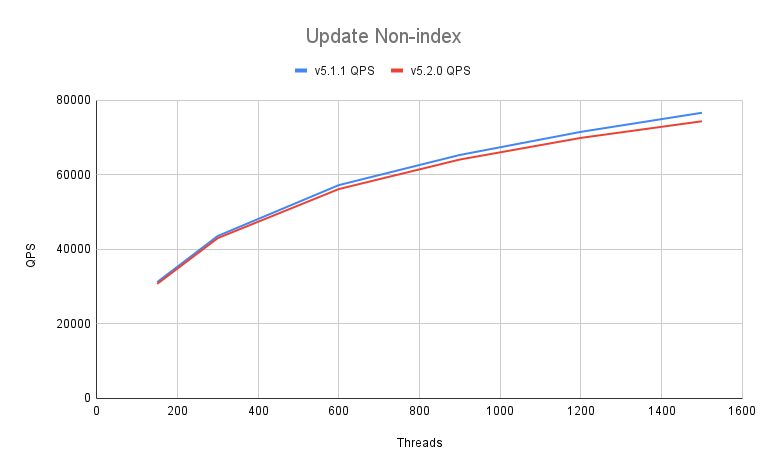
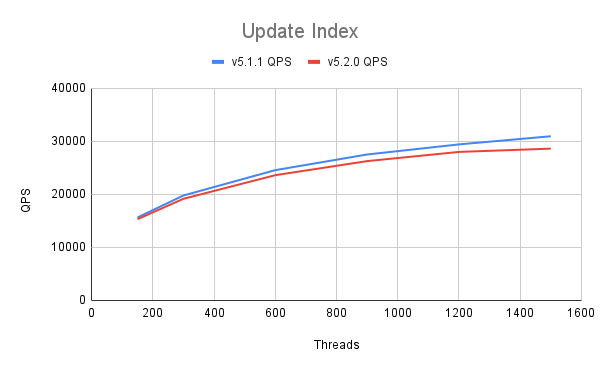
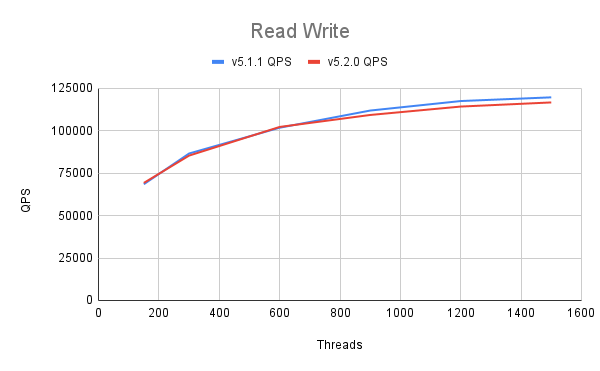
This test aims at comparing the Sysbench performance of TiDB v5.2.0 and TiDB v5.1.1 in the Online Transactional Processing (OLTP) scenario. The results show that compared with v5.1.1, the Point Select performance of v5.2.0 is improved by 11.03%, and the performance of other scenarios is slightly reduced.
Test environment (AWS EC2)
Hardware configuration
| Service type | EC2 type | Instance count |
|---|---|---|
| PD | m5.xlarge | 3 |
| TiKV | i3.4xlarge | 3 |
| TiDB | c5.4xlarge | 3 |
| Sysbench | c5.9xlarge | 1 |
Software version
| Service type | Software version |
|---|---|
| PD | v5.1.1 and v5.2.0 |
| TiDB | v5.1.1 and v5.2.0 |
| TiKV | v5.1.1 and v5.2.0 |
| Sysbench | 1.1.0-ead2689 |
Parameter configuration
TiDB v5.2.0 and TiDB v5.1.1 use the same configuration.
TiDB parameter configuration
log.level: "error"
performance.max-procs: 20
prepared-plan-cache.enabled: true
tikv-client.max-batch-wait-time: 2000000
TiKV parameter configuration
storage.scheduler-worker-pool-size: 5
raftstore.store-pool-size: 3
raftstore.apply-pool-size: 3
rocksdb.max-background-jobs: 8
raftdb.max-background-jobs: 4
raftdb.allow-concurrent-memtable-write: true
server.grpc-concurrency: 6
readpool.unified.min-thread-count: 5
readpool.unified.max-thread-count: 20
readpool.storage.normal-concurrency: 10
pessimistic-txn.pipelined: true
server.enable-request-batch: false
TiDB global variable configuration
set global tidb_hashagg_final_concurrency=1;
set global tidb_hashagg_partial_concurrency=1;
set global tidb_enable_async_commit = 1;
set global tidb_enable_1pc = 1;
set global tidb_guarantee_linearizability = 0;
set global tidb_enable_clustered_index = 1;
Test plan
- Deploy TiDB v5.2.0 and v5.1.1 using TiUP.
- Use Sysbench to import 16 tables, each table with 10 million rows of data.
- Execute the
analyze tablestatement on each table. - Back up the data used for restore before different concurrency tests, which ensures data consistency for each test.
- Start the Sysbench client to perform the
point_select,read_write,update_index, andupdate_non_indextests. Perform stress tests on TiDB via HAProxy. The test takes 5 minutes. - After each type of test is completed, stop the cluster, overwrite the cluster with the backup data in step 4, and restart the cluster.
Prepare test data
Execute the following command to prepare the test data:
sysbench oltp_common \
    --threads=16 \
    --rand-type=uniform \
    --db-driver=mysql \
    --mysql-db=sbtest \
    --mysql-host=$aws_nlb_host \
    --mysql-port=$aws_nlb_port \
    --mysql-user=root \
    --mysql-password=password \
    prepare --tables=16 --table-size=10000000
Perform the test
Execute the following command to perform the test:
sysbench $testname \
    --threads=$threads \
    --time=300 \
    --report-interval=1 \
    --rand-type=uniform \
    --db-driver=mysql \
    --mysql-db=sbtest \
    --mysql-host=$aws_nlb_host \
    --mysql-port=$aws_nlb_port \
    run --tables=16 --table-size=10000000
Test results
Point Select performance
| Threads | v5.1.1 QPS | v5.1.1 95% latency (ms) | v5.2.0 QPS | v5.2.0 95% latency (ms) | QPS improvement |
|---|---|---|---|---|---|
| 150 | 143014.13 | 2.35 | 174402.5 | 1.23 | 21.95% |
| 300 | 199133.06 | 3.68 | 272018 | 1.64 | 36.60% |
| 600 | 389391.65 | 2.18 | 393536.4 | 2.11 | 1.06% |
| 900 | 468338.82 | 2.97 | 447981.98 | 3.3 | -4.35% |
| 1200 | 448348.52 | 5.18 | 468241.29 | 4.65 | 4.44% |
| 1500 | 454376.79 | 7.04 | 483888.42 | 6.09 | 6.49% |
Compared with v5.1.1, the Point Select performance of v5.2.0 is improved by 11.03%.

Update Non-index performance
| Threads | v5.1.1 QPS | v5.1.1 95% latency (ms) | v5.2.0 QPS | v5.2.0 95% latency (ms) | QPS improvement |
|---|---|---|---|---|---|
| 150 | 31198.68 | 6.43 | 30714.73 | 6.09 | -1.55% |
| 300 | 43577.15 | 10.46 | 42997.92 | 9.73 | -1.33% |
| 600 | 57230.18 | 17.32 | 56168.81 | 16.71 | -1.85% |
| 900 | 65325.11 | 23.1 | 64098.04 | 22.69 | -1.88% |
| 1200 | 71528.26 | 28.67 | 69908.15 | 28.67 | -2.26% |
| 1500 | 76652.5 | 33.12 | 74371.79 | 33.72 | -2.98% |
Compared with v5.1.1, the Update Non-index performance of v5.2.0 is reduced by 1.98%.

Update Index performance
| Threads | v5.1.1 QPS | v5.1.1 95% latency (ms) | v5.2.0 QPS | v5.2.0 95% latency (ms) | QPS improvement |
|---|---|---|---|---|---|
| 150 | 15641.04 | 13.22 | 15320 | 13.46 | -2.05% |
| 300 | 19787.73 | 21.89 | 19161.35 | 22.69 | -3.17% |
| 600 | 24566.74 | 36.89 | 23616.07 | 38.94 | -3.87% |
| 900 | 27516.57 | 50.11 | 26270.04 | 54.83 | -4.53% |
| 1200 | 29421.10 | 63.32 | 28002.65 | 69.29 | -4.82% |
| 1500 | 30957.84 | 77.19 | 28624.44 | 95.81 | -7.54% |
Compared with v5.0.2, the Update Index performance of v5.1.0 is reduced by 4.33%.

Read Write performance
| Threads | v5.1.1 QPS | v5.1.1 95% latency (ms) | v5.2.0 QPS | v5.2.0 95% latency (ms) | QPS improvement |
|---|---|---|---|---|---|
| 150 | 68471.02 | 57.87 | 69246 | 54.83 | 1.13% |
| 300 | 86573.09 | 97.55 | 85340.42 | 94.10 | -1.42% |
| 600 | 101760.75 | 176.73 | 102221.31 | 173.58 | 0.45% |
| 900 | 111877.55 | 248.83 | 109276.45 | 257.95 | -2.32% |
| 1200 | 117479.4 | 337.94 | 114231.33 | 344.08 | -2.76% |
| 1500 | 119662.91 | 419.45 | 116663.28 | 434.83 | -2.51% |
Compared with v5.0.2, the Read Write performance of v5.1.0 is reduced by 1.24%.
