TiDB Sysbench パフォーマンス テスト レポート -- v5.1.0 対 v5.0.2
テストの概要
このテストは、オンライン トランザクション処理 (OLTP) シナリオで TiDB v5.1.0 と TiDB v5.0.2 の Sysbench パフォーマンスを比較することを目的としています。結果は、v5.0.2 と比較して、v5.1.0 の Point Select パフォーマンスが 19.4% 向上し、Read Write および Update Index のパフォーマンスがわずかに低下したことを示しています。
テスト環境(AWS EC2)
ハードウェア構成
| サービスの種類 | EC2タイプ | インスタンス数 |
|---|---|---|
| PD | m5.xlarge | 3 |
| TiKV | i3.4xlarge | 3 |
| TiDB | c5.4xlarge | 3 |
| シスベンチ | c5.9xlarge | 1 |
ソフトウェアバージョン
| サービスの種類 | ソフトウェアバージョン |
|---|---|
| PD | v5.0.2 および v5.1.0 |
| TiDB | v5.0.2 および v5.1.0 |
| TiKV | v5.0.2 および v5.1.0 |
| シスベンチ | 1.0.20 |
パラメータ構成
TiDB v5.1.0 と TiDB v5.0.2 は同じ構成を使用します。
TiDB パラメーター構成
log.level: "error"
performance.max-procs: 20
prepared-plan-cache.enabled: true
tikv-client.max-batch-wait-time: 2000000
TiKV パラメータ設定
storage.scheduler-worker-pool-size: 5
raftstore.store-pool-size: 3
raftstore.apply-pool-size: 3
rocksdb.max-background-jobs: 8
raftdb.max-background-jobs: 4
raftdb.allow-concurrent-memtable-write: true
server.grpc-concurrency: 6
readpool.unified.min-thread-count: 5
readpool.unified.max-thread-count: 20
readpool.storage.normal-concurrency: 10
pessimistic-txn.pipelined: true
server.enable-request-batch: false
TiDB グローバル変数の構成
set global tidb_hashagg_final_concurrency=1;
set global tidb_hashagg_partial_concurrency=1;
set global tidb_enable_async_commit = 1;
set global tidb_enable_1pc = 1;
set global tidb_guarantee_linearizability = 0;
set global tidb_enable_clustered_index = 1;
テスト計画
- TiUP を使用して TiDB v5.1.0 および v5.0.2 をデプロイします。
- Sysbench を使用して、各テーブルに 1,000 万行のデータがある 16 個のテーブルをインポートします。
- 各テーブルで
analyze tableのステートメントを実行します。 - 異なる同時実行テストの前に、復元に使用されるデータをバックアップします。これにより、各テストのデータの一貫性が保証されます。
- Sysbench クライアントを起動して、
point_select、read_write、update_index、およびupdate_non_indexのテストを実行します。 HAProxy を介して TiDB でストレス テストを実行します。テストには 5 分かかります。 - 各タイプのテストが完了したら、クラスターを停止し、手順 4 のバックアップ データでクラスターを上書きし、クラスターを再起動します。
テストデータの準備
次のコマンドを実行して、テスト データを準備します。
sysbench oltp_common \
    --threads=16 \
    --rand-type=uniform \
    --db-driver=mysql \
    --mysql-db=sbtest \
    --mysql-host=$aws_nlb_host \
    --mysql-port=$aws_nlb_port \
    --mysql-user=root \
    --mysql-password=password \
    prepare --tables=16 --table-size=10000000
テストを実行する
次のコマンドを実行して、テストを実行します。
sysbench $testname \
    --threads=$threads \
    --time=300 \
    --report-interval=1 \
    --rand-type=uniform \
    --db-driver=mysql \
    --mysql-db=sbtest \
    --mysql-host=$aws_nlb_host \
    --mysql-port=$aws_nlb_port \
    run --tables=16 --table-size=10000000
試験結果
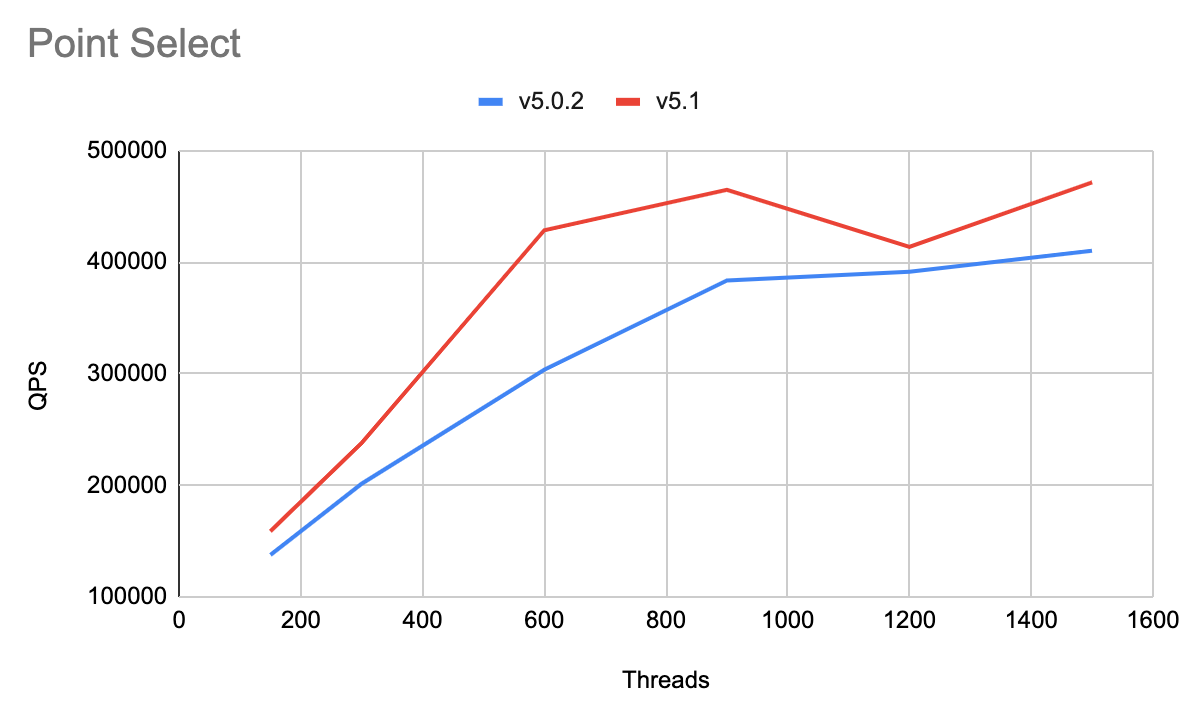
ポイントセレクト性能
| スレッド | v5.0.2 QPS | v5.0.2 95%レイテンシー(ミリ秒) | v5.1.0 QPS | v5.1.0 95%レイテンシー(ミリ秒) | QPS の向上 |
|---|---|---|---|---|---|
| 150 | 137732.27 | 1.86 | 158861.67 | 2 | 15.34% |
| 300 | 2014年20.58 | 2.91 | 238038.44 | 2.71 | 18.18% |
| 600 | 303631.52 | 3.49 | 428573.21 | 2.07 | 41.15% |
| 900 | 383628.13 | 3.55 | 464863.22 | 3.89 | 21.18% |
| 1200 | 391451.54 | 5.28 | 413656.74 | 13.46 | 5.67% |
| 1500 | 410276.93 | 7.43 | 471418.78 | 10.65 | 14.90% |
v5.0.2 と比較すると、v5.1.0 の Point Select のパフォーマンスは 19.4% 向上しています。
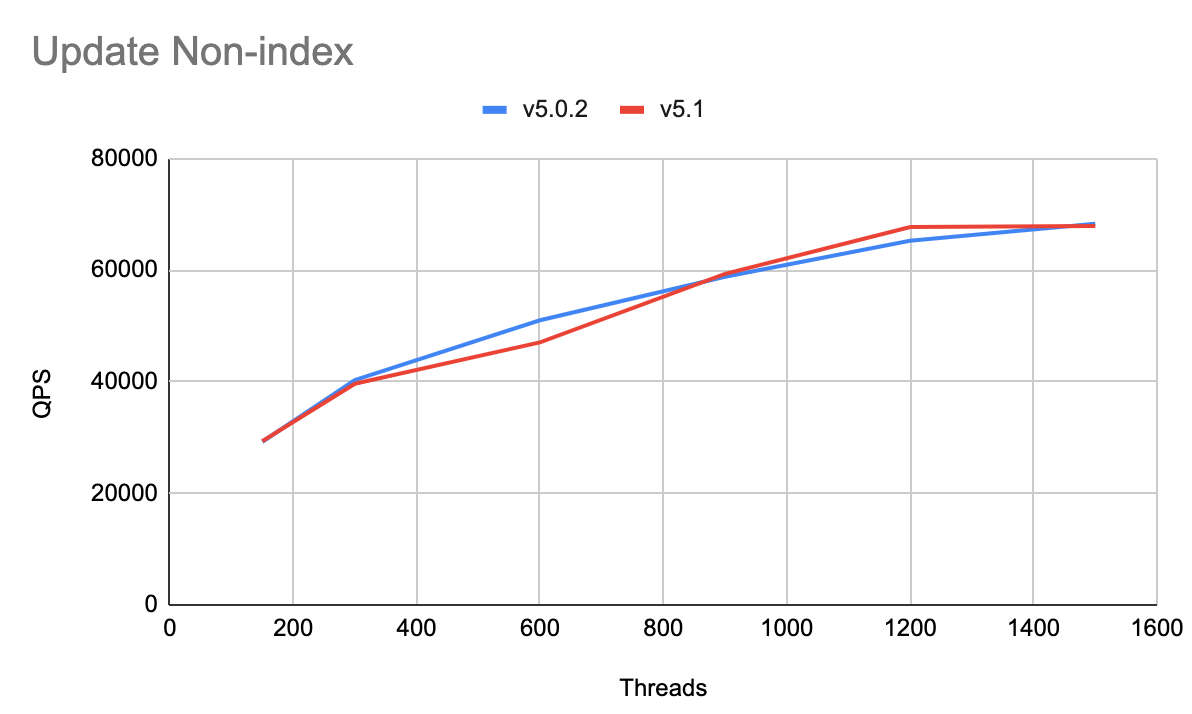
インデックス以外のパフォーマンスを更新
| スレッド | v5.0.2 QPS | v5.0.2 95%レイテンシー(ミリ秒) | v5.1.0 QPS | v5.1.0 95%レイテンシー(ミリ秒) | QPS の向上 |
|---|---|---|---|---|---|
| 150 | 29248.2 | 7.17 | 29362.7 | 8.13 | 0.39% |
| 300 | 40316.09 | 12.52 | 39651.52 | 13.7 | -1.65% |
| 600 | 51011.11 | 22.28 | 47047.9 | 27.66 | -7.77% |
| 900 | 58814.16 | 27.66 | 59331.84 | 28.67 | 0.88% |
| 1200 | 65286.52 | 32.53 | 67745.39 | 31.37 | 3.77% |
| 1500 | 68300.86 | 39.65 | 67899.17 | 44.17 | -0.59% |
v5.0.2 と比較すると、v5.1.0 の Update Non-index パフォーマンスは 0.8% 低下しています。
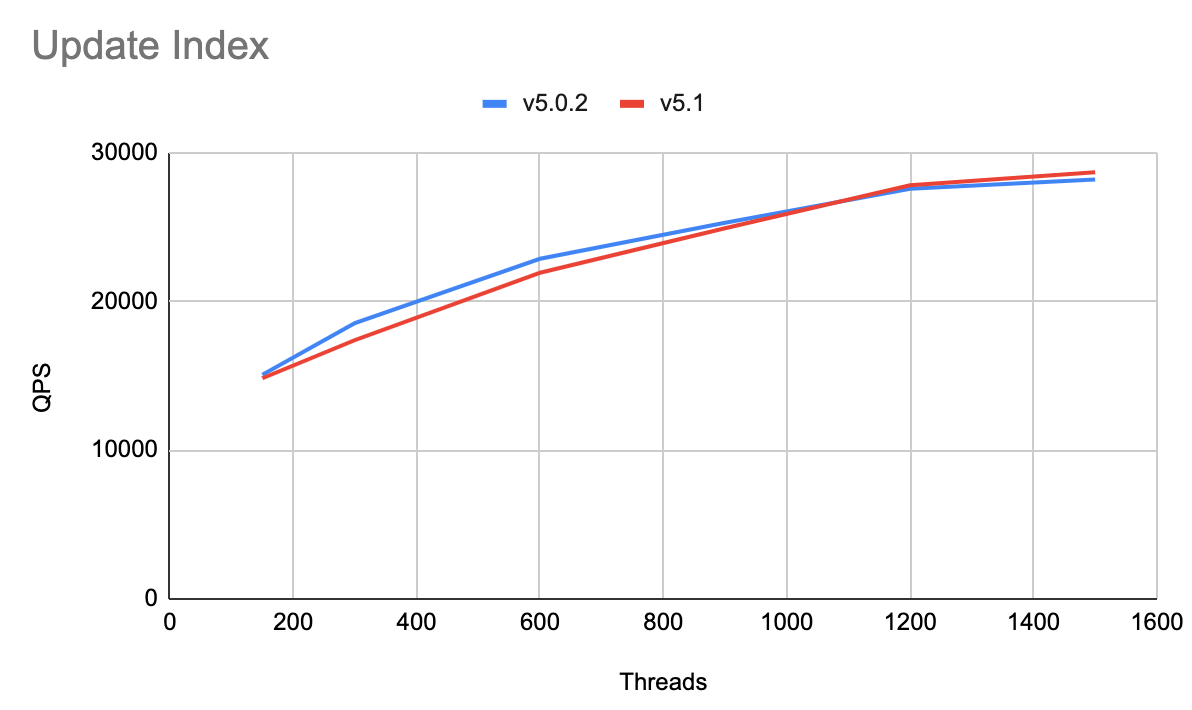
インデックスのパフォーマンスを更新する
| スレッド | v5.0.2 QPS | v5.0.2 95%レイテンシー(ミリ秒) | v5.1.0 QPS | v5.1.0 95%レイテンシー(ミリ秒) | QPS の向上 |
|---|---|---|---|---|---|
| 150 | 15066.54 | 14.73 | 14829.31 | 14.73 | -1.57% |
| 300 | 18535.92 | 24.83 | 17401.01 | 29.72 | -6.12% |
| 600 | 22862.73 | 41.1 | 21923.78 | 44.98 | -4.11% |
| 900 | 25286.74 | 57.87 | 24916.76 | 58.92 | -1.46% |
| 1200 | 27566.18 | 70.55 | 27800.62 | 69.29 | 0.85% |
| 1500 | 28184.76 | 92.42 | 28679.72 | 86 | 1.76% |
v5.0.2 と比較すると、v5.1.0 の Update Index のパフォーマンスは 1.8% 低下しています。
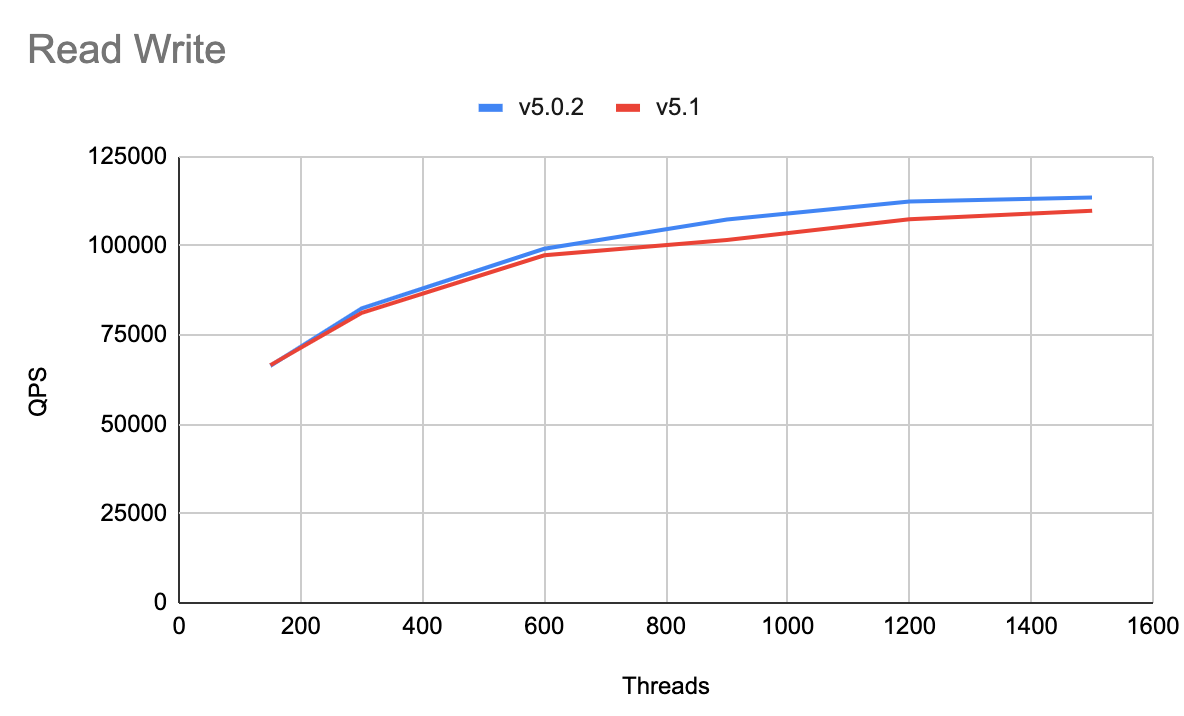
読み書き性能
| スレッド | v5.0.2 QPS | v5.0.2 95%レイテンシー(ミリ秒) | v5.1.0 QPS | v5.1.0 95%レイテンシー(ミリ秒) | QPS の向上 |
|---|---|---|---|---|---|
| 150 | 66415.33 | 56.84 | 66591.49 | 57.87 | 0.27% |
| 300 | 82488.39 | 97.55 | 81226.41 | 101.13 | -1.53% |
| 600 | 99195.36 | 173.58 | 97357.86 | 179.94 | -1.85% |
| 900 | 107382.76 | 253.35 | 101665.95 | 267.41 | -5.32% |
| 1200 | 112389.23 | 337.94 | 107426.41 | 350.33 | -4.42% |
| 1500 | 113548.73 | 450.77 | 109805.26 | 442.73 | -3.30% |
v5.0.2 と比較すると、v5.1.0 の読み書きパフォーマンスは 2.7% 低下しています。
Playground
新規
登録なしで TiDB の機能をワンストップでインタラクティブに体験できます。